GEOGRAPHY FORM 1

Concept Of Geography
Geography Form 1
 Study Notes
 Discuss
 Bookmarks
Physical and human environments make up the two major geographical phenomena. The term phenomena refer to facts or circumstances observed, or observable within nature. Therefore, a geographical phenomenon, in this case, is an occurrence or fact in the geographical science. Geographical phenomena can be artificial (e.g. buildings), natural (e.g. rivers) or mixed type (e.g. smog).
The Meaning of the Term Geography
Define the term geography
The term "geography" comes from the ancient Greeks, who needed a word to describe the writings and maps that were helping them make sense of the world in which they lived. It is a combination of two Greek words: "geo" and "graphia". In Greek, "geo" means “Earth” and "graphia" means “to write, draw or describe”.
These two words together form geography, which means to draw, write about or describe the Earth. These meanings led to the development of the early definition of geography which referred to description of the Earth by words, maps and statistics and included both the physical Earth and everything found on it such as plants, animals and people. Therefore, geography is the study of the distribution and interrelationship of phenomena in relation to the Earth’s surface. Alternatively, geography can be described as the study of the Earth and its environment.
Geographers explore both the physical properties of Earth’s surface and the human societies spread across it. They also examine how human culture interacts with the natural environment and the way locations and places can have an impact on people. Geography seeks to understand where things are found, why they are there, and how they develop and change over time.
There are two branches of geography, namely physical geography, and human and economic geography:
- Physical geography - mainly concerned with the study of Earth’s seasons, weather, climate, soil, streams, landforms, and oceans. All of these features form the physical environment which includes all natural features found on the Earth’s surface such as water bodies, mountains, rivers, plains, natural forests, etc.
- Human and economic geography - involves the study of human activities on the Earth's surface. Human activities include farming, trade, mining, transportation, settlement, tourism, etc.

Fig 1.1 A section of Uluguru Mountain Ranges showing physical features (mountains) and man-made or human features (buildings)
Inter-relationship between different geographical phenomena
There exist interrelationships between different geographical phenomena. Physical environment interacts with living organisms in a number of ways. For example, land resources provide soil that supports plant growth.
Sun rays generate heat which leads to the evaporation of water; then water vapour forms clouds and eventually rain. The rainfall feeds plants, i.e., it supports plant growth. Plants are food for herbivores and omnivores such as human beings.
Climate determines the types of plant and animal species that can survive in a particular geographical area and influences human population distribution. Climate also determines human activities like farming, tourism, and settlement. On the other hand, human activities can lead to modification of physical environments, for example, soil degradation, land reclamation, and forest conservation

Fig 1.2 Human activities such as quarrying can lead to soil degradation
The Importance of Studying Geography
Geography answers questions about the natural and human worlds. The following are some of the reasons for studying geography:
- To develop knowledge of places and environments throughout the world. This will help in solving issues about the environment and sustainable development.
- Geography serves as an important link between the natural and social sciences. As you study geography, you encounter different societies and cultures. This helps you realize how nations rely on each other.
- To help us understand basic physical systems that affect everyday life. For instance, how water cycles and ocean currents work are all explained with geography. These are important systems to monitor and predict in order to help lessen the impact of disasters.
- To learn the location of places and the physical and cultural characteristics of those places in order to function more effectively in our increasingly interdependent world.
- To enable us explore the methods and strategies used by other nations for economic developments and how Tanzania can borrow and employ the same for a similar purpose.
- To be able to make sensible judgement about spatial distribution of human settlements in relation to physical environment.
- To gain knowledge about the available, finite resources that the Earth has been endowed with and how to manage and use them sustainably.
- To help us take care of the world around us by understanding others better and knowing the limitations of the Earth. This enable us make our planet a more liveable one.
- To understand various types of natural environments and how to harness them for equitable use by the present and future generations.
- To gain positive attitudes and values which enable one become a responsible and successful member of the society.
- To serve as the basis for further studies in specialized fields such as cartography (the science of map making), land survey, meteorology (the study of weather and weather forecasting), climatology (study of climate), seismography (the scientific measuring and recording of the shock and vibrations of Earthquakes), teaching, aviation and research.

Fig 1.3 A cartographer at work
Components of the Solar System
Name the Components of the Solar System
When we look at the sky at night we see thousands of bright bodies. These are stars and planets. Our Earth is one of the planets. Sometimes we can see a group of stars which form patterns called constellations. In some occasions we can see bright, moving objects. These are called meteorites.
The arrangement of the planets in relation to the position of the sun is called the solar system. The name is derived from a Latin word sol which means sun. The solar system is made up of the sun, planets, moons, natural satellites, asteroids, meteors, comets, dust, ice, and interplanetary space (it contains interplanetary dust and interplanetary gas).
All planets and other bodies revolve around the sun. The sun is the central body of the solar system, and it is the only body that generates its own heat. Bodies that revolve around the sun are kept in their orbits (paths) by the sun’s powerful force of gravity.
There are eight known planets in the solar system. The planets, starting from the one closest to the sun are: Mercury, Venus, Earth, Mars, Jupiter, Saturn, Uranus, and Neptune.
The four innermost planets in the solar system, Mercury, Venus, Earth and Mars are also called terrestrial planets. They are called terrestrial because they have a compact, rocky surface like the Earth's.
Jupiter, Saturn, Uranus, and Neptune are known as the Jovian (Jupiter-like) planets, because they are all gigantic compared with Earth, and they have a gaseous nature like Jupiter's. The Jovian planets are also referred to as the gas giants, although some or all of them might have small solid cores.

Fig 1.4 The solar system
You grew up learning that the solar system consists of nine planets, including Pluto as one as those planets. However, the International Astronomical Union (IAU) stripped Pluto of this status in 2006.
When Pluto was discovered in 1930, it was hailed as the ninth planet in the solar system based on an overestimation of its size. But it looked out of place among the larger planets following the discovery of swarms of ‘ice dwarfs’—icy rocks in the Kuiper Belt, at the very edge of the solar system billions of miles from the sun. This prompted some astronomers to suggest that Pluto could be just another Kuiper Belt Object (KBO), disappointing generations of schoolchildren who grew up learning that Pluto was the smallest planet in the solar system.
On the other hand, this was also a question of meaning or definition of the term ‘planet’. Pluto is clearly big enough for gravity to give it a round shape like any planet (unlike KBOs that tend to be misshapen). It revolves around the sun like other planets. It has an atmosphere and seasons, too.
When the IAU demoted Pluto to a “dwarf planet”, it spelt out three conditions that a celestial body must meet to qualify as a planet: 1) it must be round; 2) it must orbit the sun; and 3) it must have “cleared the neighbourhood” of its orbit (a planet’s gravity sweeps and clears the space around it of other objects). Pluto follows the first two rules, but it hasn’t cleared the neighbourhood of its orbit—which put it in the category of “dwarf planets”. (Of the five known dwarf planets, Pluto, Makemake, Haumea and Eris are located beyond Neptune. The fifth, Ceres, is located in the asteroid belt between Mars and Jupiter.).
Importance of the Components of Solar System
Describe the importance of the components of solar system
Though the solar system has many components, the two most important components of the solar system are the Earth and the sun. The Earth sustains lives of a diversity of living organisms (plants and animals). The Earth contains numerous resources that enable living organisms to thrive in it. The Earth’s atmosphere contains water and air (a mixture of several gases that are used by living organisms for survival). In general, the Earth is the only planet known to sustain life.
The sun is the source of all energy that supports life on Earth. The sun is responsible for water cycle and it is responsible for weather conditions and climate. The moon lights the Earth on some days of the month, though it gets its light from the sun.
The following is an outline of some importance of the sun:
- The sun is very important in the plants’ growth. The sun helps the plants to make their own food by the photosynthesis process.
- The sun is very necessary for the other living organisms, that is, it provides us with light for the vision and to do our work.
- The sun provides us with the heat to warm our bodies.
- The sun provides some animals and humans (that feed on plants) with food as it helps the plants to make its own food by the photosynthesis process.
- The sun is used in heating water and warming houses by the solar heater which changes the solar energy of the sun into the heat energy. The heat energy is used in warming houses and heating water.
- The sun is very important in the formation of the clouds, rain, and winds. The sun evaporates the water in the seas, lakes and oceans into water vapour. When the water vapour rises in the sky, it cools and condenses forming the clouds, which eventually forms rain.
The sun is a medium star. It is one of the millions of stars that you see at night in the sky. It looks much bigger because it is closer to the Earth than other stars. The sun is much larger than the Earth, in fact much larger than all the other components of the solar system put together. The sun is the main source of energy that the planets receive. It is composed of approximately 75% hydrogen, 23% helium, and 2% for all other elements. The Earth is relatively cold but the sun is so hot that nearly all molecules are broken into their separate atoms and all are mixed together into a single hot gas.
Dimension of the Sun in Relation to Other Space Bodies
State the dimension of the sun in relation to other space bodies
The diameter of the sun is 1.392 million kilometres. Its mass is approximately 330,000 times greater than that of the Earth. The sun shines brightly because of its very high temperatures. The average surface temperature is 6,000 degrees Centigrade. It is much hotter in the interior where it is about 14 million degrees Centigrade.
Characteristics of the Sun
Describe the characteristics of the sun
The Sun contains 99.85% of all the matter in the Solar System. The planets, which condensed out of the same disk of material that formed the Sun, contain only 0.135% of the mass of the solar system. Jupiter contains more than twice the matter of all the other planets combined. Satellites of the planets, comets, asteroids, meteoroids, and the interplanetary medium constitute the remaining 0.015%.
Concept Of Geography
Geography Form 1
The Term Solar Energy
Define the term solar energy
The sun is the source of all energy on Earth. This sun’s energy is what we call solar energy. Solar energy can be defined as the radiant (light and heat) energy produced by the sun.
Different Uses of Solar Energy
Suggest different uses of solar energy
Solar energy has been used for thousands of years in many different ways by people all over the world. The following are some of different uses of solar energy in everyday life:
(i) Generation of electricity: It is used to generate electricity by use of solar panels. Solar energy is captured by solar panels and stored in batteries. The electricity generated by this means can be used in powering various machines and devices where other power supplies are absent, such as in remote places.

Fig 1.5 Charging a cell phone using a rechargeable battery
A solar panel charges a rechargeable battery that in turn charges your cell phone. This means you can charge your phone even when there is no sunlight, at night for example, so long as you've charged your battery during the day.
(ii) Heating, cooking and drying: It is used directly in heating, cooking, and drying clothes, meat, fish, fruits and grains, among other traditional uses. A solar cooker which traps heat from the sun can be used for cooking food.
(iii) Photosynthesis: It is used by growing plants for making their own food through the processes of photosynthesis.
(iv) Formation of coal and oil: Coal is solar energy stored in the bodies of plants that grew thousands of years ago, and which after being buried under the Earth for a very long period, turned into coal. Similarly, oil was formed from dead bodies of organisms.
(v) Formation of rainfall: Evaporation of water which is necessary for cloud and finally rainfall formation also uses solar energy.
(vi) Production of vitamin D in the skin: The most well-known source of vitamin D is via synthesis in the skin induced by sun exposure.
(vii) Production of salt from sea water: The process of harvesting salt from sea water involves evaporation of sea water in evaporation ponds or tanks. As water evaporates, it leaves the salt in tanks or ponds, from which it is collected and processed further before use.
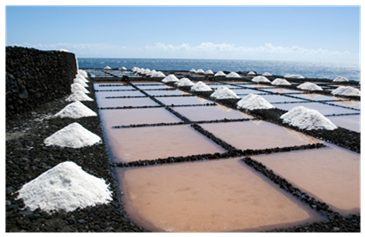
Fig 1.6 Harvesting salt from the sea by evaporation
How the Use of Solar Energy Promotes Environmental Conservation
Explain how the use of solar energy promotes environmental conservation
Solar energy is one of the clean sources of energy in the world due to the fact that it does not produce pollution to the environment during its use. It is a clean source of energy and environmental friendly. The following outline explains how solar energy promotes environmental conservation to our communities:
- Solar energy does not release carbon dioxide gases into the atmosphere (our aerial environment).
- The use of solar energy reduces the demand for charcoal and firewood as a source of energy in our households, an act which reduces the cutting down of trees, which could otherwise lead to environmental degradation.
- The use of solar energy encourages the preservation, conservation and sustainable utilization of forest resources.
- Reduced use of firewood means retaining more trees that could be cut down for firewood. Trees, in turn, absorb excess carbon dioxide from the air, thus helping to purify the air and balance the gases in the atmosphere. Similarly, solar energy from sunlight is used by plants during photosynthesis to produce glucose and release oxygen into the atmosphere.
- Solar energy reduces dependency on kerosene and spirit which burn to produces smoke that pollutes the environment.
- Unlike oil (used in generators to produce electricity), coal, charcoal, and firewood, solar energy is renewable source of energy. It is obtained daily during sunshine and it is permanent and reliable.
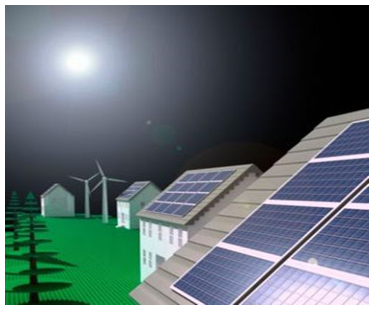
Fig 1.7 Solar panels on roof tops absorbing the sun’s heat energy
How Solar Energy May Contribute to Emancipation of Women
Explain how solar energy may contribute to emancipation of women
In African societies, the task of fetching firewood, cooking, washing, and taking care of children falls mainly under women and girls. The use of solar energy for cooking, heating and performing other household duties, means allowing more free time for women and girls as they are relieved from the burden of fetching and carrying firewood. As a result, women will have ample time to participate in other income-generating activities such as trade and farming. On the other hand, girls will attend to schools and perform as better as boys do.
Better still, the use of solar energy in place of firewood will improve the women’s health because they will not be exposed to soot, ashes and smoke generated by firewood when burnt. Solar energy is clean energy. It does not pollute the environment or affect women while cooking. Therefore, the use of solar energy in performing different household duties will make life of the women easy.

Fig 1.8 Village women carrying firewood on their heads
Concept Of Geography
Geography Form 1
Apart from planets, there are other heavenly bodies that are found in the solar system. Most of these bodies are much smaller than the planets and some of them revolve around the planets. They include comets, asteroids, meteors, and natural satellites.
Characteristics of Comets, Asteroids, Meteors and Satellites
Describe the characteristics of comets, asteroids, meteors and satellites
Comets
Comets are objects with leading heads and bright tails in the sky. Sometimes they can be seen at night. They are composed mainly of rock, ice, dust, and frozen gases. A combination of all of these components gives the comet a shiny appearance. As the comet passes near the sun, it leaves a tail of dust. Comets orbit around the sun far beyond the limits of Pluto (Fig 1.4). They can be seen from the Earth only when their orbits overlap that of the Earth. This is because other times their orbits are very far away.

Fig 1.9 A typical comet
Asteroids
Asteroids are solid heavenly bodies revolving around the sun, but are too small to be called planets. Tens of thousands of these minor planets are gathered between the orbits of Mars and Jupiter. The largest asteroid has a diameter of just less than 800 kilometres. These bodies can only be seen with a telescope because they are very far away from the Earth.
Asteroids are found in a portion of the solar system called asteroid belt. As the name suggests, this is a belt where asteroids are most likely to occur. The section is found between Mars and Jupiter. The largest of the existing asteroids is called Ceres, with a diameter of approximately 930 kilometres.
Meteors
Meteors are pieces of hard matter falling from outer space. They can be seen when they come close to the Earth, at about 110-145 kilometres above the Earth’s surface, whereas as a result of friction with the atmosphere, they become hot and usually disintegrate. But when they don’t disintegrate completely in passing through the atmosphere, they teach the Earth's surface as large boulders known as meteorites. These bodies are usually made of nickel, iron and silica. Sometimes meteors reach the Earth’s surface with such a force that they make large holes or craters called meteor craters.
Natural satellites
A natural satellite or moon (in the most common usage) is an astronomical body that orbits a planet or minor planet (or sometimes another small solar system body).
The largest known satellite is the moon. Other planets also have large moons, e.g., Jupiter’s Galilean moons (Ganymede, Callisto, Io, and Europa), Saturn’s moon (Titan) and Neptune’s moon (Triton).
Four dwarf planets are also known to have natural satellites: Pluto (Charon, Hydra, Nix, Kerberos, and Styx); Haumea (Hiʻiaka and Namaka), Makemake [S/2015 (136472) 1]; and Eris (Dysnomia). As of January 2012, over 200 minor-planet moons have been discovered.
Most of the 178 known natural satellites are irregular moons, while only 19 are large enough to be round. Ganymede, followed by Titan, Callisto, Io and Earth's Moon are the largest natural satellites in the solar system.

Fig 1.10 Some natural satellites (moons) in the solar system
Local Incidents Linked to Meteorites
Narrate local incidents linked to meteorites
There are two known meteorites in Tanzania. One is found in Mbozi district in Mbeya region and another is in Malampaka in Kwimba district of Mwanza region. These meteorites fell from space and reached the Earth in 1930 and they formed large holes on the Earth’s surface.
Concept Of Geography
Geography Form 1
The Earth is the third planet from the sun. It is the only planet known to have an atmosphere containing free oxygen, oceans of liquid water on its surface, and supports life. About three quarters (¾) of the Earth’s surface is covered by water.
Earth is the fifth largest of the planets in the solar system, smaller than the four gas giants namely Jupiter, Saturn, Uranus and Neptune, but larger than the three other rocky planets, Mercury, Mars and Venus.
The Shape of the Earth and its Evidence
Describe the shape of the earth and its evidence
The Earth is not perfectly round. Its shape is an oblate spheroid which is a flattened sphere. The flattening is very slight at the poles than at the equator.
There are many ways to prove that the Earth is spherical. The following are some of them:
- Circumnavigation of the Earth: The first voyage around the world by Ferdinand Magellan and his crew, from 1519 to 1522, proved beyond doubt that the Earth is spherical. No traveller going round the world by land or sea has ever encountered an abrupt edge, over which he would fall. Modern air routes and ocean navigation are based on the assumption that the Earth is round. If you travel in an aeroplane in a straight path, flying non-stop, you will eventually come back where you started your journey. This is what is called circumnavigation.
- The circular horizon: The distant horizon viewed from the deck of a ship at sea, or from a cliff on land is always and everywhere circular in shape. This circular horizon widens with increasing altitude and could only be seen on a spherical body.
- Ship’s visibility: When a ship appears over the distant horizon, the top of the mast is seen first before the hull. In the same way, when it leaves harbour, its disappearance over the curved surface is equally gradual. If the Earth were flat, the entire ship would be seen or obscured all at once.
- Sunrise and sunset: The sun rises and sets at different times in different places. As the Earth rotates from west to east, places in the east see the sun earlier than those in the west. If the Earth were flat, the whole world would have sunrise and sunset at the same time. But we know this is not so.
- The lunar eclipse: The shadow cast by the Earth on the moon during a lunar eclipse is always circular. It takes the outline of an arc of a circle. Only a sphere can cast such a circular shadow.
- Planetary bodies are spherical: All observations from telescopes reveal that the planetary bodies, the sun, moon, satellites and stars have circular outlines from whichever angle you see them. They are strictly spheres. Earth, by analogy, cannot be the only exception.
- Driving poles on level ground on the Earth: Engineers when driving poles of equal length at regular intervals on the ground have found they do not give a perfect horizontal level. The centre pole normally projects slightly above the poles at either end because of the curvature of the Earth. Surveyors and field engineers therefore have to make certain corrections for this inevitable curvature, i.e. 12.6 cm to 1 km.
- Space photographs: Pictures taken from high altitudes by rockets and satellites show clearly the curved edge of the Earth. This is perhaps the most convincing and the most up-to-date proof of the Earth's sphericity.
Concept Of Geography
Geography Form 1
The Earth and all other planets revolve around the sun.
Types of Earth's Movements
Describe the types of earth's movements
The Earth is in motion all the time. People cannot feel this motion because, like all other planets, they move with it. There are two types of movements of the Earth, namely:
- The rotation of the Earth on its own axis.
- The revolution of the Earth around the sun.
The Term Rotation
Describe the term rotation
Rotation refers to the spinning of a body on its axis. The Earth rotates or spins on its axis in an anti-clockwise direction, from West to East through 360 degrees. It makes one complete rotation in 24 hours. Thus, for every 15 degrees of rotation, the Earth takes one hour which is the same as four minutes for every 1 degree.
An axis is an imaginary line joining the N (North) and S (South) poles through the centre of the Earth.
The rotation of the Earth is very rapid although it is difficult to feel its motion. At the equator, every point of the Earth's surface is travelling eastwards at about 1600 km per hour. At latitude 40 degrees, the speed is about 1280 km per hr.
The Earth’s axis makes an angle of 66 ½ degrees with the plane of its orbit. In other words, the axis is tilted 23 ½ degrees from the perpendicular.

Fig. 1.11 Rotation of the Earth
Evidence to Prove that the Earth Rotates
Give evidence to prove that the earth rotates
The following observations illustrate that the Earth rotates from West to East:
- When travelling in a fast moving vehicle, you notice that trees and other objects on both sides of the road are moving fast in the opposite direction. This observation is similar to the movement of the Earth in relation to the sun.
- At night most of the stars appear to move across the sky from West to East. This observation shows that the point of observation (Earth) is moving from West to East.
- Sunrise and sunset: the sun rises over the eastern horizon in the morning and sets over the western horizon in the evening. But since the sun is in the centre of the solar system and the fact that it does not move, this shows that the point of observation (the Earth) is moving by rotation from West to East.
- Day and Night: During the Earth's rotations some regions face the sun while others do not face it. The regions facing the sun experience day time whereas the regions which are not facing the sun are in darkness (night). If the Earth was not rotating, one half of the Earth would be having daylight while the other half would be in total darkness forever. The occurrence of day and night proves that the Earth is rotating.
- Photographs of the Earth taken from the satellite at different times of the day show that different parts of the Earth experience daylight at different times. If the Earth was not rotating, different photographs taken at any time of the day would all look alike.

Fig. 1.12 Day and night
Significances of Earth's Rotation
Explain the significances of earth's rotation
The rotation of the Earth is very important because it causes the following phenomena:
- Alternation of day and night: Rotation of the Earth causes the side of the Earth which face the sun to experience daylight which is the day, whereas the side that is not facing the sun at that time will be in darkness (night). This ensures that, at any time of the day, one half of the Earth is in darkness and the other is in daylight. If the Earth did not rotate then its one half would be in daylight while the other half would be in darkness all the year round.
- The occurrence of tides: Tides are the periodic rise and fall of sea levels caused by the combined effects of the gravitational forces exerted by the moon and the sun on the rotating Earth.
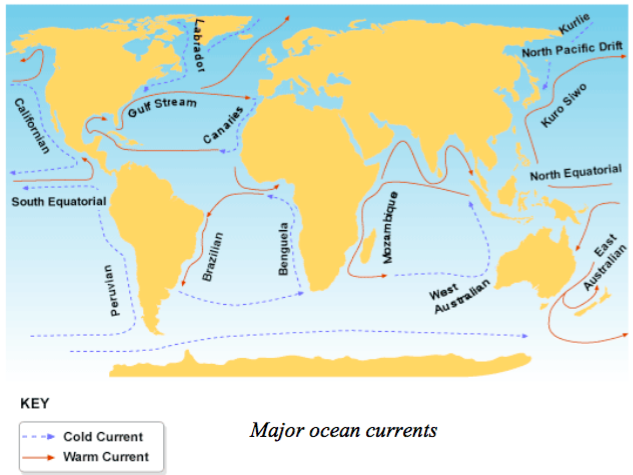
- Deflection of winds and ocean currents: As the Earth rotates on its axis from West to East, winds and ocean currents flowing over the Earth’s surface are deflected. The anticlockwise rotation of the Earth deflects prevailing winds to the right in the northern hemisphere and to the left in the southern hemisphere.
- Time difference between longitudes: The rotation is responsible for the difference in time between different places on Earth. It causes the difference of one hour in every 15 degree interval between longitudes, which is equivalent to 4 minutes for each degree of longitude.

Fig 1.13 Deflection of winds and ocean currents
The Term Revolution
Define the term revolution
In Geography and Astronomy, the word rotation is defined as the motion of one body around another. The Earth revolves around the sun and the moon revolves around the Earth.
The Process of Revolution
Explain the process of revolution
The Earth is at aphelion each year on 4th July, when it is at the maximum distance of 152 million kilometres form the sun. The Earth is at perihelion each year on 3rd January when it is at the minimum distance of 147 million kilometres.
The Earth's revolution around the sun takes a year (365¼ days). Therefore, the average speed of revolution is about 29.6 kilometres per second. A normal year has only 365 days. The remaining fraction of ¼ day is added once in four years to make a leap year of 366 days.

Fig 1.14 Revolution of the Earth
The Result of the Earth's Revolution Around the Sun
Describe the result of the earth's revolution around the sun
The revolution of the Earth around the sun and the inclination (tilting) of its axis results in the following:
- The four seasons of the year, namely summer, autumn, winter and spring. A season is one of the distinct periods into which the year may be divided.
- Change in the altitude of the midday sun at different times of the year at any place.
- Varying lengths of the day and night at different times of the year. The axis of the Earth is inclined to its elliptical plane at an angle of 66.5 degrees. If the axis of the Earth was vertical, the sun rays would always be overhead at the Equator, thus all places on the Earth would always experience 12 hours of daylight (day) and 12 hours of darkness (night).
- The eclipses (eclipse of the sun and eclipse of the moon).
Four seasons
Because of the inclination of the Earth’s axis to the orbital plane, the angle at which the sun rays shrike the Earth’s surface varies. This leads to seasonal changes which are mainly experienced in the high and mid latitude regions. This results in four distinct seasons namely, spring, summer, autumn and winter.
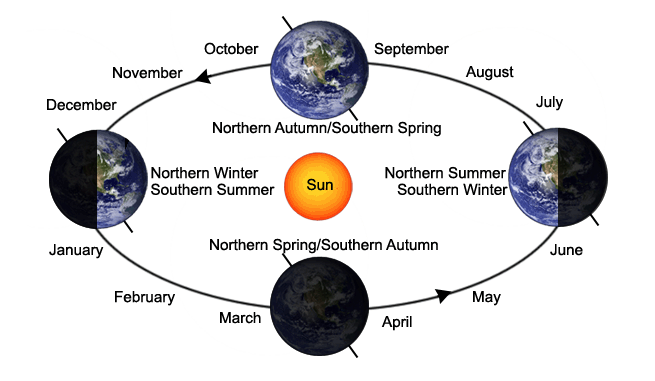
Fig 1.15 The seasons
Seasons are not experienced in the equatorial regions (for example most parts of Africa, Tanzania inclusive) because the sun is almost overhead at all places and the lengths of days and nights are almost equal throughout the year.
Change in altitude of the midday sun
Because of the inclination of the Earths’ axis, the midday sun is directly overhead at the Tropic of Cancer on 21st June; and at the Tropic of Capricorn on 22nd December. This is called the solstice. On 21st June, it is winter solstice in the southern hemisphere and summer solstice in the northern hemisphere. On 22nd December, it is winter solstice in the northern hemisphere and summer solstice in the southern hemisphere. On 21st march and 23rd September, the midday sun is directly overhead at the Equator. These are the only two days in the year when all places on Earth have almost equal hours of day and night. This is known as the equinox.
Table 1.2 shows dates on which the sun is vertically overhead at the Tropic of Cancer, Tropic of Capricorn and the Equator. The resulting seasons are also indicated.
Table 1.2 dates of overhead sun in different parallels of latitude
| Latitude | Date of overhead sun | Hemisphere | Name |
| Equator | 21st March | Northern | Spring equinox |
| Southern | Autumnal equinox | ||
| 23rd September | Northern | Autumnal equinox | |
| Southern | Spring equinox | ||
| Tropic of Cancer | 21st June | Northern | Summer solstice |
| Southern | Winter solstice | ||
| Tropic of Capricorn | 22nd December | Northern | Winter solstice |
| Southern | Summer solstice |
Varying lengths of day and night
Not all places across the Earth experience the same lengths of day and night. Some places receive long hours of daylight than darkness while others receive long hours of darkness than daylight. This is because the Earth’s axis is inclined at 66 ½ degrees to the orbital plane (23 ½ degrees to the perpendicular). The Earth remains permanently inclined at this angle as it revolves around the sun.
If the Earth’s axis was perpendicular to its orbital plane, all places on the Earth’s surface would have equal days of daylight and darkness throughout the year.
In December, it is winter in the southern hemisphere and the hours of darkness increase steadily. The further away a place is from the equator, the longer the nights. Beyond the Arctic Circle (66 ½ºN) towards the North Pole, the number of days of complete darkness increase. The North Pole is in complete darkness for half a year.
Eclipses
Eclipse refers to the partial or complete obscuring of one celestial (heavenly) body by another. An eclipse occurs when one celestial body moves in between another heavenly body and its source of light (the sun). Eclipses normally occur when the sun or moon is obscured from the view for a short period. This means that an eclipse will only occur when the sun, moon and Earth are in straight or nearly straight line.
Now, how are eclipses related to revolution of the Earth? The answer is simple: as the Earth revolves around the sun and the moon revolves around the Earth, there comes a time when the moon and the Earth are in a straight line. As a result, an eclipse of the moon (lunar eclipse) or the sun (solar eclipse) occurs, depending on which body (the Earth or the moon) causes an obstruction:
Lunar eclipse
This eclipse occurs when the Earth passes between the moon and the sun and the Earth’s shadow falls on the moon.

Fig 1.16 Lunar eclipse
Solar eclipse
Solar eclipse occurs when the Moon passes between the Earth and the Sun, thus casting its shadow onto the Earth. In this type of eclipse the Moon fully or partially blocks the Sun, leading to total or partial eclipse respectively.

Fig 1.17 Solar eclipse.
Concept Of Geography
Geography Form 1
The Parallels and Meridians
Define the parallels and meridians
Parallels are more commonly known as latitudes. Latitude refers to the angular distance North or South of the equator calibrated in degrees, minutes and seconds, measured from the centre of the Earth. The equator is given a value of 0º. It is an imaginary line which divides the Earth into two hemispheres (northern hemisphere and southern hemisphere). The Northern hemisphere has latitude of 90ºN and the Southern hemisphere has latitude of 90ºS. All other latitudes are drawn north or south, parallel to the equator. A particular latitude, say 60ºN joins all points on the surface of the Earth which make an angle of 60º from the centre of the Earth (the equator). Any circle drawn around the Earth, parallel to the equator, is a parallel of latitude. Table 1.3 shows important parallels and figure 1.18 shows the location of these parallels on the Earth’s surface.
Table 1.3 important parallels
| Parallel | Latitude |
| North Pole | 90°N |
| Arctic Circle | 66 ½ °N |
| Tropic of Cancer | 23 ½ °N |
| Equator | 0° |
| Tropic of Capricorn | 23 ½ °S |
| Antarctic Circle | 66 ½ °S |
| South Pole | 90°S |
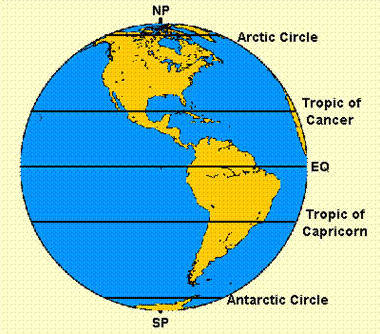
Fig 1.18 Location of parallels on Earth
Meridians are commonly known as longitudes. A longitude is an imaginary line drawn on the map from the North Pole to the South Pole. Meridians are numbered in degrees East or West of longitude 0°, called Greenwich Meridian (because it passes through a town in England called Greenwich). It is also known as the Prime Meridian because it is the line of reference from which all other meridians are established.
A longitude, therefore, refers to angular distance measured in degrees East and West of the Greenwich Meridian. The Prime Meridian runs through the poles and the Greenwich observatory near London. All lines of longitude are in equal length and divide the Earth into two equal semi circles. There are 360° in a circle, with 180° lying east of the Greenwich Meridian and the other 180° west of Greenwich.
The Greenwich line has been chosen by convention (meaning that any other line could have served the same purpose).
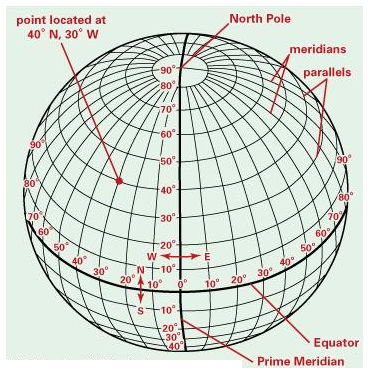
Fig 1.19 Longitudes and latitudes
How Latitudes and Longitudes are Determined
Describe how latitudes and longitudes are determined
Determining latitudes
All latitudes are determined in reference to the equator (0°). The angle of latitude is determined by measuring angles from the centre of the Earth and from the equatorial plane towards the North or South Pole. It is stated in degrees north or south of the equator, e.g., 30°S, 15°N, 45°N, etc.
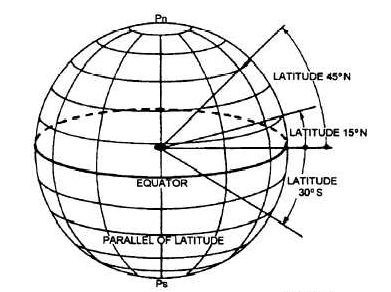
Fig 1.20 Determining latitudes
Determining longitudes
The angle of longitude is determined by measuring the angle from the centre of the Earth, along the equatorial plane towards the East or West of Prime Meridian. The value of a latitude is expressed as the angle between the Prime Meridian and the point on any latitude East or West of the Prime Meridian, e.g. 45°E, 30°W, etc.
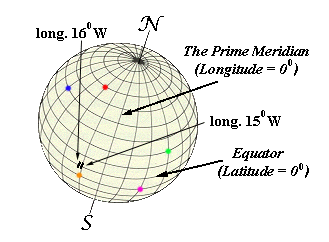
Fig 1.21 Determining longitudes
Importance of a Great Circle
Explain the importance of a great circle
A Great Circle is any circle that circumnavigates the Earth and passes through the centre of the Earth. A great circle always divides the Earth into halves. Thus, the Equator is the only latitude that is a great circle since it divides the Earth into two equal halves; and all lines of longitude are great circles.
Countless great circles can be drawn around the Earth so long as they pass through the centre of the Earth and that they divide the Earth into two equal halves.
Importance of great circles
The shortest distance between any two points on the Earth lies along a great circle passing through the two points. For this reason, great circles are used in plotting routes for ships crossing large stretches of ocean water and aircraft flying great distances in space. Captains and pilots of ships and aircraft, respectively, travel by following great circles in order to save fuel and time because by following the great circle they travel the shortest possible distance to reach their destinations.
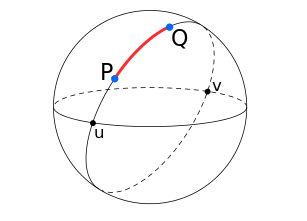
Fig 1.22 Great circles
Importance of Parallels and Meridians
Discuss the importance of parallels and meridians
Longitudes and latitudes are very important to any geographer or map reader. The importance of longitudes and latitudes include the following:
- They are used by pilots and sailors to guide their paths as they steer the planes and ships.
- When used together, longitude and latitude define a specific location through geographical coordinates (Fig 1.23).Each location on Earth has its unique latitude and longitude. For example, the location of a point shown on figure 1.23 below is 40°N,60°W.
- Longitudes enable geographers to calculate the local time of a place, X, given the local time and longitude of place Y, as the point of reference.
- Latitudes are used as a guide to explain the variation in climate on the surface of the Earth. It is generally known that places along the equatorial belt experience a hot and wet climate for most of the year. As you move north or south of the equator, the climate progressively become cold. Places at the north and south poles are extremely cold and are covered by ice and snow throughout the year.
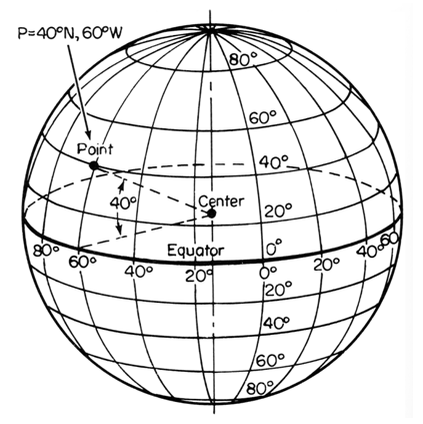
Fig 1.23 Locating the position of a place
Calculating Local Time
Calculate local time
The Earth rotates on its own axis once every 24 hours (1 day). Since the Earth turns 360° in 24 hours, it turns 1° in 4 minutes (24×60/360 = 4 minutes). All places along a given meridian will experience midday sun at the same time. Time recorded along a given meridian is known as local time. Since longitude 0° is called Prime Meridian or Greenwich Meridian, the local time at longitude 0° is called Greenwich Mean Time (GMT). It is the reference time for all local times across the globe. When it is 12.00 noon on the Greenwich meridian, it will be 1.00 pm at a place 15°E or 11.00 am at a place 15°W.
Local mean time can easily be calculated at any place once the longitude is known because if the Earth completes one rotation (360°) in 24 hrs, it passes through 15° of longitude in 1 hour, and 1° in 4 minutes.
Example 1
Find the local time for Musoma (34°E) in Tanzania, when it is 12 noon for Kinshasa (15° 30’) in DRC.
Solution
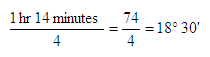
(i) Find the difference in degrees of longitude between Musoma and Kinshasa: 34° - 15° 3’ = 18° 30’ = 18.5°
(ii) Find the difference in time:
The difference in time between the two places is 18.5/15, which gives 1 hr 14 minutes.
(iii) Since Musoma is to the East of Kishasha, its local time should be ahead of that of Kinshasa. Therefore, the local time for Musoma is 12.00 noon plus 1 hr 14 minutes which is 1.14 pm.
On the other hand, given the time difference between two places and the longitude of one of them, we can calculate the longitudinal position of the second place.
Example 2
Kinshasa is 15° 30’E and it is 1 hr 14 min behind the time of Musoma. Find the longitudinal position of Musoma.
Solution.
(i) The difference in time between Kinshasa and Musoma is 1 hr 14 min.
(ii) The difference in degrees of longitude between Kinshasa and Musoma is:
(iii) Since the time for Kinshasa is behind that of Musoma, then Musoma must be to the east of Kinshasa. Therefore, the longitudinal position for Musoma = 15° 30’ + 18° 30’ = 34°E
We can also find the time and longitudinal position of two places located on either side of the Greenwich meridian.
Example 3
The local time for place, X, located 15°W is 11 am. Find the local time for a place, Y, located 5°E.
Solution,
(i) Find the difference in degrees of longitude between X and Y:
15° + 5° = 15°
(ii) Find the difference in time:-
The difference in time between the two places is 15/15, which gives 1 hr
(iii) Since Y is to the east of X, its local time should be ahead of that of X. Therefore, the local time for Y is 11.00 am plus 1 hr, i.e., 12.00 noon.
Time and Time Zone
Define time and time zone
Time refers to a period that is used for an activity. It is normally measured in seconds, minutes, hours, days, weeks, months, years, decades, centuries or millenniums. A time zone refers to a zone where standard time is accepted throughout a longitudinal zone 15° in width.
Essence of Time and Time Zone
Explain the essence of time and time zone
There would be problems in telling time if every place had its own time set according to the local time. For example, there would be a great confusion in railways and airways timetables or radio programmes if they had to show different times, each referring to one particular place within a small area. In order to avoid this problem, different stretches of land take their time from agreed meridians. The time adopted is known as standard time. For example, Tanzania, Kenya, Uganda, Ethiopia, Djibouti and Somalia use the same standard time. This is commonly referred to as the East African Standard time. In East Africa, standard time is taken from 45°E. When a whole stretch of land keeps the same standard time, that stretch forms a time zone. Standard time is the time of the longitude (meridian) near the centre of the time zone.
Variation of Standard Time in a Single Country
Explain variation of standard time in a single country
There are 24 time zones in the world. The Greenwich Meridian (GMT) is the starting point for dividing the globe into 24 time zones. The standard time for Greenwich is known as Greenwich Mean Time. Countries with large stretches of land like Canada, USA, and Russia have several time zones. They have different standard times for different regions within the same country.
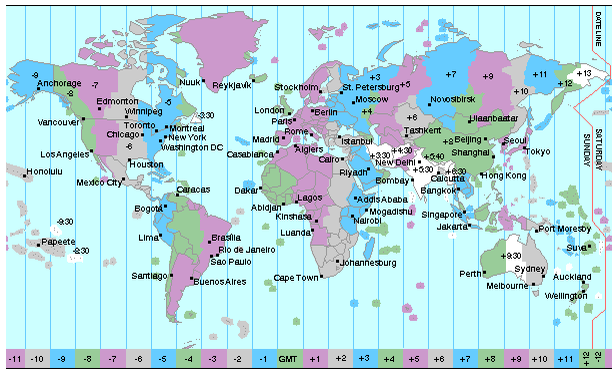
Fig 1.24 Time zones
International Date Line
Define International Date Line
The International Date Line is the line where date is changed or where the calendar day begins. This line roughly follows the 180° meridian east (or west) of Greenwich. It is also known as the line of demarcation.
When you cross the International Date Line from east to west, you lose a day, and if you cross the line from west to east, you gain a day. If at Greenwich it is noon on Tuesday, a place 90°W would be 6.00 am on Tuesday; at a place 180°W it would be midnight on Monday. On the other hand, a place 90°E would be 6.00 pm on Tuesday and at place 180°E it would be midnight on Tuesday.
Location of International Date Line
Locate International Date Line
The International Date Line, established in 1884, passes through the mid-Pacific Ocean and roughly follows a 180° longitude. It is located halfway round the world from the prime meridian (0° longitude), established in Greenwich, England, in 1852. Greenwich is the reference point of time zones. The line zigzags at some points to enable all parts of a country keep the same date. If the line was to cross a country, island or groups of islands belonging to the same country, then that country would record two different dates on the same day. This problem was avoided by diverting the line at some points (Fig 1.25).
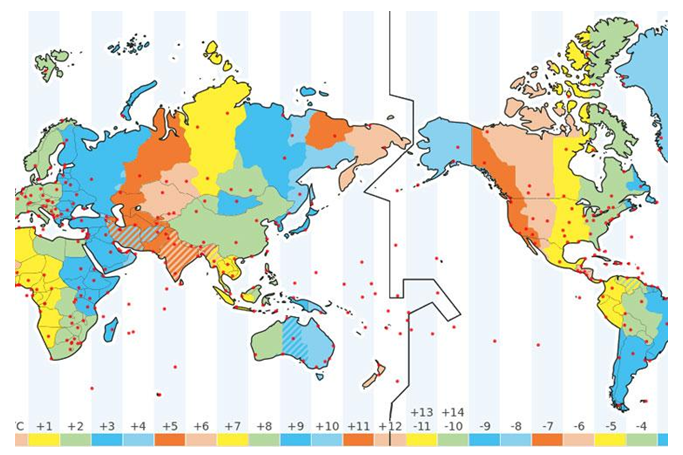
Fig 1.26 International Date Line
Major Features Of The Earth's Surface
Geography Form 1
Meaning of a Continent
Explain the meaning of a continent
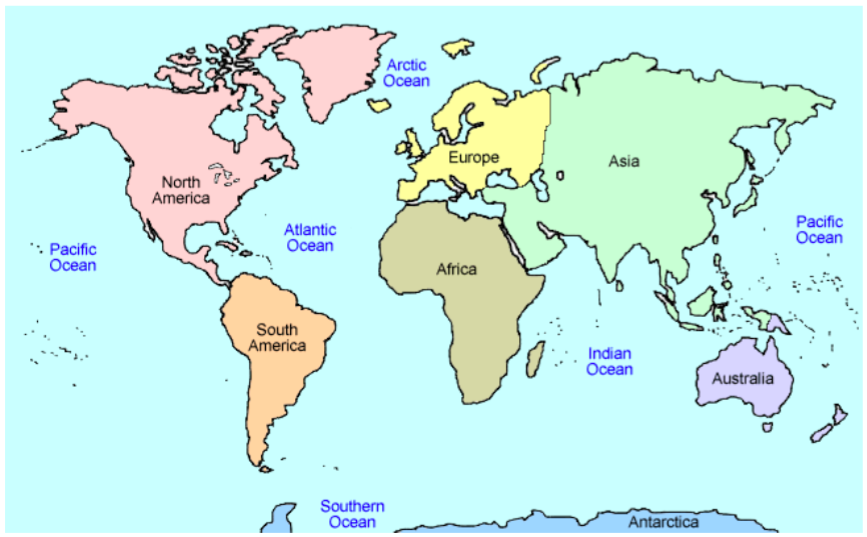
The land surface occupies 29% of the surface of the globe, and the remaining 71% is covered by water. The land surface forms seven continents. A continent is a major landmass rising from the ocean floor. It includes islands adjacent to the continent. There are seven continents namely, Africa, Asia, South America, North America, Europe, Australia and Antarctica. These continents are surrounded by the following oceans: The Indian Ocean, the Atlantic Ocean, the Pacific Ocean, the Arctic Ocean and the Southern ocean.
There is more land surface in the northern hemisphere than in the southern hemisphere but there is more water surface in the southern hemisphere than in the northern hemisphere. The continents are broader in the northern hemisphere. The seven continents that make up the globe are explained below:
- Australia: Australia is the smallest continent and it is about a quarter of the size of Africa. Its size is about 8.5 million square kilometres. Australia is approximately 10°S and 40°S and between 115°E and 150°E. The islands of New Zealand to the south east of Australia are part of this continent. The continent is bordered to the west and north by the Indian Ocean, to the east by the Pacific Ocean, and to the south by the Southern Ocean.
- Europe: Europe is the sixth continent in size and it is about two-fifth the size of Africa. The size of Europe is 9.8 million square kilometres. Most of Europe lies between 40°N and the 1 Arctic circle, and between 10°W and 60°E. It lies to the west of Asia, separated by the Ural Mountains. Europe is bordered to the north by the Arctic Ocean, to the west by the Atlantic Ocean, and to the south by the Mediterranean Sea.
- Antarctica: Antarctica is the fifth continent in size and it is about one-third the size of Africa. Its area is about 11.4 million square kilometres. This is the southernmost continent, forming a circle at the South Pole and extends south of 661⁄2°S. It is surrounded by the southern ocean. The continent is mostly uninhabited.
- North America: North America is the fourth continent in size and it is slightly more than half the size of Africa. Its size is about 17.9 million square kilometres. If extends from 10°N to 65°N and from 60°W to 160°W. It is bordered to the west by the Pacific Ocean, to the East by the Atlantic Ocean, and the North by the Arctic Ocean.
- South America: South America is the third largest continent and it is about two-thirds the size of Africa. Its size is about 24.3 million square kilometres. It lies between 10°N and 50°S and between 35°W and 80°W. This continent is bordered to the east by the Atlantic Ocean, to the West by the Pacific Ocean, and it is joined to North America by the Isthmus of Panama.
- Africa: Africa is the second largest continent with an area of about 3.6 square kilometres. Africa extends from 37°N to 35°S and from 50°W to 50°E and it is crossed by Tropics of Cancer and Capricorn. Thus the greater part, about three quarters of the whole area lies in the tropics. Africa is bordered to the north by the Mediterranean Sea, to the west by the Atlantic Ocean, and to the East by the Indian Ocean.
- Asia: Asia is the largest of all continents. It covers more than one third of the land surface of the earth. It is approximately one and a half times the size of Africa. Its total area is about 45.6 million square kilometres. Asia stretches from 0° to 67°N and from 30°E to about 18°E. The Ural Mountains form the boundary between Asia and Europe. This continent is attached to Africa by the narrow Isthmus of Suez which has been dug to form the Suez Canal. The continent is bordered to the North by the Arctic Ocean, to the East by the Pacific Ocean, and to the South by the Indian Ocean.
The following table summarizes the location and area of all seven continents discussed above:
| Continent | Geographical location | Area (Million Km2) |
| Asia | 0° - 67° N; 30° - 180° E | 45.6 |
| Africa | 37° N - 55° S; 15° W - 50° E | 30.6 |
| South America | 10° N - 50° S; 35° W - 80° W | 24.3 |
| North America | 10° N - 65° N; 60° W - 160° W | 17.9 |
| Antarctica | Between the South Pole and 66½ °S | 11.4 |
| Europe | 40° N and the Arctic Circle ; 10° W - 60° E | 9.8 |
| Australia | 10° S - 40° S; 115° E - 150° E | 8.5 |
Major Features of the Continent
Identify the major features of the continent
The surface of the continents is not smooth. It has mountains, hills, rivers and valleys, plateaus, and plains. Mountains are landforms which have high relief generally over 300 metres above the surrounding area. Hills are landforms that have moderate relief generally between 150 and 300 metres above the surrounding area. Plateaus are extensive highland areas with more or less uniform summit level, bounded by one or more slopes falling steeply away, sometimes rising on one or more sides by steep slopes to mountain ridges. Plains are continuous sketches of comparatively flat land not much above sea level, sometimes gently rolling or undulating.
Mountains
There are four types of mountains. These are the Fold Mountains, Block Mountains, Residual Mountains, and Volcanic Mountains. These mountains are all named according to the way they were formed.
- Fold Mountains:Fold Mountains are formed by wrinkling or (folding) of the Earth’s crust. Fold Mountains usually form parallel ranges which extend for hundreds of miles across a continent. Thus, Fold Mountains are the most extensive ranges in the world. For example, the Rocky Mountains in North America vary in width from 640 to 1,600 kilometres and are about 5,000 kilometres in length. These types of mountains have some of the highest peaks in the world. Mount Everest in the Himalayas is 8,848 metres above sea level and the Aconcagua in the Andes is 7,003 metres above sea level. Examples of Fold Mountains include the Himalayas in Asia; the Rockies in North America; the Andes in South America; the Alps in Europe; the Atlas in North Africa; the Cape ranges in South Africa; the Appalachians in the USA; and the Great Dividing Ranges in Australia.
- Block Mountains:Block Mountains are formed when a movement in the earth’s crust forces the rocks to break instead of folding. As a result enormous cracks or faults are formed. When two sets of faults run parallel to each other and the ground between is forced to rise up, a block (fault) mountain is formed. Usually Block Mountains do not extend over wide areas as Fold Mountains do. Examples of Block Mountains are the Usambara, Uluguru and Ruwenzori Mountains in Africa; the Vosges and Black Forest Mountains in Europe; and Mount Sinai in Asia.
- Residual Mountains:Residual mountains are formed when an area of highland remains standing above the general level of land after the rivers and other natural agents have lowered the surface of the surrounding area. Sometimes such highlands are called mountains of denudation. These mountains may in some cases appear as isolated hills but in other cases they appear as long ridges, generally steep on one side (the scarp slope) and gentle on the other side (dip slope). Examples of residual mountains are the Ahaggar Mountains of central Sahara; the Sekenke hills of Singida in Tanzania; the Admawa mountains of eastern Nigeria; the Highlands of Scotland; the Sierras of central Spain; and the Mesas and Buttes of the western plateau of the United States.
- Volcanic Mountains:Volcanic mountains are formed from the piling up and cooling of hot molten lava and ashes that are thrown out from the earth’s interior after a volcanic eruption. Some of the volcanic mountains existing today were built up by a single eruption, but others were built by several eruptions. Volcanic eruptions are still taking place in some parts of the earth. Among the existing volcanic mountains, some still experience periodic eruptions, for example, the Vesuvius in Italy; the Krakatoa in Indonesia; the Mufimbiro in Uganda; and the Oldoinyo-Lengai in Tanzania. The Volcanic Mountains that still experience periodic eruptions are called active volcanic mountains.The Volcanic Mountains which erupted once in historical times and are no longer active are said to be dormant. In this group are included the Kilimanjaro and Meru mountains in Tanzania. Those volcanic mountains which have never experienced eruption and have shown no signs of erupting again are said to be extinct (dead). Included in this group are mountains Kenya, Elgon, Ngorongoro and Rungwe in East Africa; and Demavend in Iran.Volcanic mountains are usually conical in shape and mostly contain craters or depressions at their summits, for example, mountains Fujiyama and Kilimanjaro. Sometimes the craters are filled with water to form crater lakes.
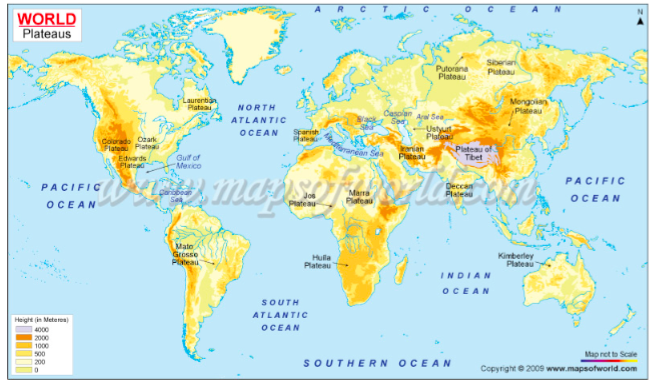
Plateaus
In geology and earth science, a plateau (plural: plateaus or plateaux), also called a high plain or tableland, is an area of highland, usually consisting of relatively flat terrain that is raised significantly above the surrounding area, often with one or more sides with steep slopes.
The largest and highest plateau in the world is the Tibetan Plateau, called the "roof of the world”. The Tibetan plateau covers approximately 2,500,000 km2 at about 5,000 m above sea level.
The second-highest plateau is Deosai National Park (also known as Deoasai Plains) at an average elevation of 4,114 m and is located in the Skardu District of Gilgit-Baltistan, in northern Pakistan.
The third-largest plateau is the Antarctic Plateau, which covers most of central Antarctica, where there are no known mountains, but rather 3,000 m or more of ice.
Other plateaus in the world include the Colorado Plateau (North America); the Great Central Plateau, Ahagger Plateau and Fouta Djallon Plateau (Africa); Brazilian Plateau (South America), Mexican Plateau and Laurentian Plateau (North America); Arabian Plateau, Deccan Plateau and Tibet Plateau (Asia).
Plains
A plain is a broad area of relatively flat land. Plains are one of the major landforms, or types of land, on Earth. They cover more than one-third of the world’s land area. Plains exist on every continent except Antarctica. Plains occur as lowlands and at the bottoms of valleys but also on plateaus or uplands at high elevations.
Plains in many areas are important for agriculture because where the soils were deposited as sediments they may be deep and fertile, and the flatness facilitates mechanization of crop production; or because they support grasslands which provide good pasture for livestock.
Plains vary widely in size. The smallest occupy only a few hectares, whereas the largest cover hundreds of thousands of square kilometres. For example, the Great Plains of North America extends from Pyrenees Range on the French–Spanish border across northern Europe and Asia, almost halfway around the world.
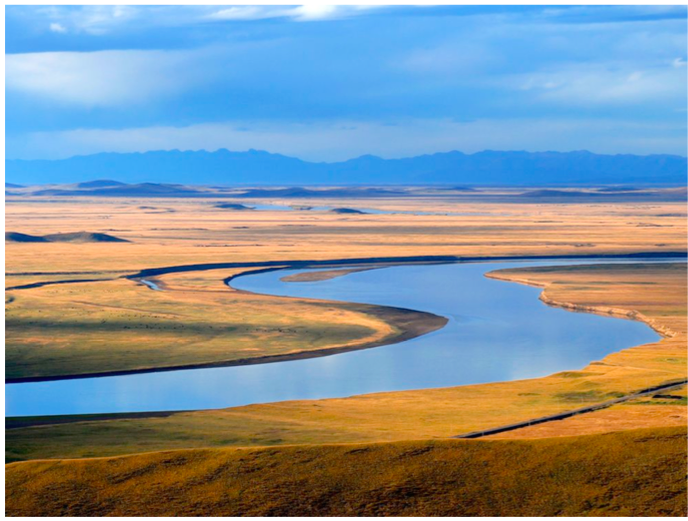
The Yellow River winds through the plains of Sichuan, China. Many rivers are surrounded by plains, or broad areas of flat land.
Major Features Of The Earth's Surface
Geography Form 1
Meaning of a Water Body
Define a water body
A water body is any significant accumulation of water, generally on a planet's surface. The term most often refers to oceans, seas, and lakes, but it includes smaller pools of water such as ponds, wetlands, or more rarely, puddles. A body of water does not have to be still or contained. Rivers, streams, canals, and other geographical features where water moves from one place to another are also considered water bodies.
Oceans and Other Water Bodies
Identify the oceans and other water bodies
An ocean is defined as a body of saline water covering much of the earth. The largest ocean is the Pacific. Its area is about 165.3 million square kilometres. The second largest ocean is the Atlantic, which covers about 82.2 million square kilometres. The Indian Ocean, covering about 73.4 square kilometres is the third largest, followed by the Arctic Ocean, covering about 14.0 million square kilometres.
Composition of ocean water
Ocean water contains a number of dissolved mineral salts. These mineral salts include sodium chloride (common salt) which makes up 78% of all salt in the ocean water; and compounds of magnesium, potassium and calcium. Most of the minerals in the ocean are a result of constant accumulation since the formation of the oceans. However, a small amount of the minerals come from the land, having been dissolved by water and brought into the ocean by rivers. But the mineral salts in rivers are only in very small quantities.
The saltiness of the ocean water is not the same everywhere. Saltiness of the ocean water depends mainly on temperature which affects the amount of salt that can dissolve in the water, the amount of fresh water brought into the ocean by rivers and rainfall, and the amount of evaporation taking place from the surface.
Water temperature
Water is heated by the sun’s rays much more slowly than land is. Water also loses heat to the air around it more slowly than the land does. This causes the temperature of the sea water to vary only slightly from season to season. In general, the temperature of the ocean water decreases from the equator, where the surface temperature is 25°C to the polar regions where the water is very cold (-2.2°C). But the decrease in temperature poleward is not uniform because of the occurrence of warm and cold ocean currents. On the other hand, water temperature decreases with depth in the tropics up to the depth where the temperature is 1.1°C.
Water movements
Ocean water is constantly in motion. There are two types of movement. One is horizontal movement, which is in the form of ocean currents and tides, and the other is vertical, which is the rising of subsurface water and the sinking of the surface water. The movements of ocean water are a result of density variations in the water which is particularly important in vertical movements and winds which are particularly important in horizontal movements.
An ocean current is the permanent or seasonal movement of surface water in the ocean. There are warm and cold currents, the ocean currents are set in motion by a combination of prevailing winds, differences in density and temperature of the ocean waters, the rotation of the earth, and the shape of landmass.
Tides are the rising and the falling in the level of water in the oceans, seas and lakes. They occur twice a day (in 24 hours). The level to which tides rise and fall varies from day to day. On the days when it rises to its highest level, it also falls to its lowest level. The rising and falling is caused by the pull of gravity of the moon and the sun.
Waves are to and from movements of the surface water. When water is thrown into waves, its surface gets a shape of ups and downs. The highest part of the wave is called the crest and the lowest the trough. The distance from one crest to the next, or from trough to trough is called the wavelength. Waves travel in some definite direction, and give the impression that they move forward, but in reality only the shape moves forward while the water moves up and down. For example, a cork thrown into the water does not travel with the waves, it moves up and down and to and fro, but not forwards. A wave is driven on the shore by wind, and its height and force are determined by the strength of the wind and the distance of open water over which it has blown.
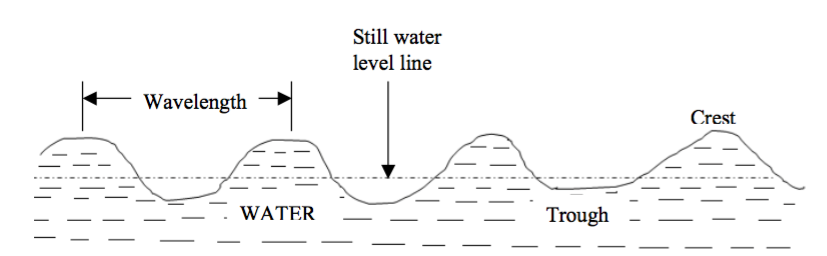
Water waves
Lakes
A lake is a natural or man-made body of water that is surrounded by land. Lakes lie on land and are not part of the ocean, and therefore are distinct from lagoons, and are also larger and deeper than ponds, though there are no official or scientific definitions. Most lakes are fed and drained by rivers and streams.
Some lakes are artificial (man-made lakes) and are constructed for industrial or agricultural use, for hydro-electric power generation or domestic water supply, or for aesthetic or recreational purposes. Examples of man-made lakes include Lake Nasser (in Egypt), Lake Kariba (Zambia), and Lake Volta (Ghana).
The majority of lakes on Earth are fresh water, and most lie in the Northern Hemisphere at higher latitudes. Most lakes have at least one natural outflow in the form of a river or stream, which maintains a lake's average level by allowing the drainage of excess water. However, some lakes do not have a natural outflow and lose water solely by evaporation or underground seepage or both.
Lakes are not evenly distributed on the earth's surface; most are located in high latitudes and mountainous regions. Although lakes are usually thought to be freshwater bodies, many lakes, especially in arid regions, become quite salty because a high rate of evaporation concentrates inflowing salts. The Caspian Sea, Dead Sea, and Great Salt Lake are among the greatest of the world's salty lakes. The Great Lakes of the United States and Canada is the world's largest system of freshwater lakes. Lake Superior alone is the world's largest freshwater lake with an area of 82,414 sq km. The Caspian Sea is the largest lake in the world, with an area of 372,960 sq km. Lake Titicaca in the Andes Mountains of South America is the world’s highest lake at 3,800 m above sea level; while the Dead Sea is the lowest at 425 m below sea level.
Rivers
A river is natural water flowing in a definite channel towards an ocean, sea, lake, desert basin, marsh or another river. In some cases, a river flows into the ground and become dry at the end of its course without reaching another body of water. Small rivers can be referred to using names such as stream, creek, brook, rivulet, and rill.
Rivers are part of the hydrological cycle. Water generally collects in a river from precipitation through a drainage basin from surface runoff and other sources such as groundwater, springs, and the release of stored water in natural ice and snowpacks (e.g. from glaciers).
Examples of rivers in Africa include the Nile, Congo, Niger, Zambezi and Orange. In Tanzania we have rivers like Rufiji, Ruvuma, Ruaha, Pangani, Wami and Malagalasi.
Features of the Ocean Floor
Describe the features of the ocean floor
The floor of the ocean is irregular. The major relief features of the ocean floor are explained below:
- Continental shelf:This is a gentle-slope margin of a continent that forms the shallow areas of oceans. These shallow areas extend from the coast to a depth of about 200 metres towards the ocean, and usually end suddenly.
- Continental slope:The continental slope is found at the point where the continental shelf forms a steep slope with the lower slope of the ocean floor towards the sea.
- Ridge:A ridge is the raised part of the ocean floor. Some of these rides appear above the surface of the oceans as oceanic islands.
- Ocean deep or trench:An ocean deep is a long, narrow depression (or trough) found on the ocean floor.
- Deep sea plain (ocean plain):An ocean plain is the most extensive, flat area of the ocean floor. It is a monotonous and undulating area. A large part of the plain is covered by mud.

A generalized section across an ocean floor
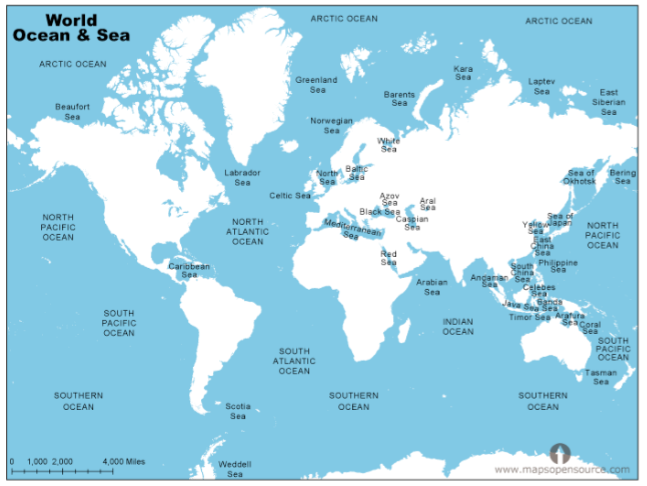
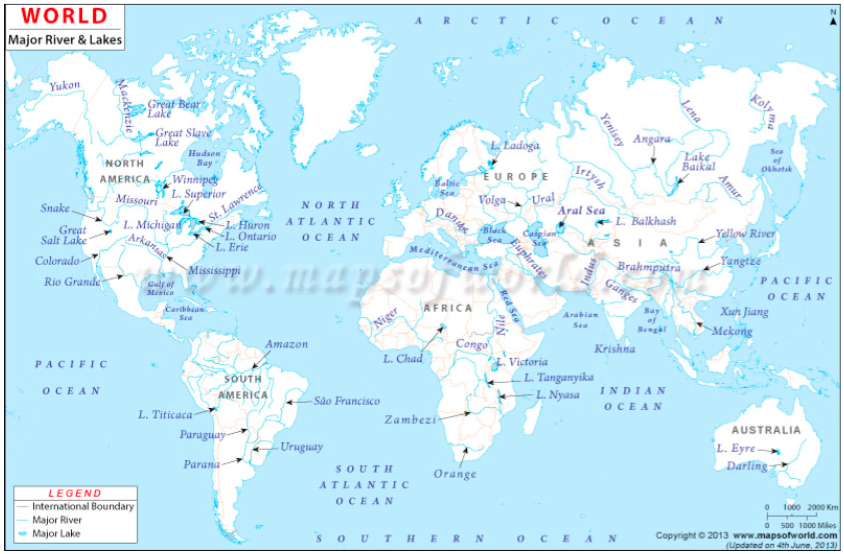
The Map Showing the Distribution of Continents and Water Bodies
Draw the map to show the distribution of continents and water bodies
The Map showing distribution of water bodies.
Weather
Geography Form 1
Meaning of Weather
Define weather
Weather is defined as conditions of the atmosphere which occur at a place at specific time periods, that is, from hour to hour or day to day. It changes from time to time and from place to place. For example, it may be raining in the morning and sunny in the afternoon.
Weather may also be defined as the day-to-day state of the atmosphere, and its short-term variation in minutes to several weeks.
How do you feel when seated in a classroom on a cloudy day? You probably feel cold. Don’t you? Now, suppose you move outside the classroom on a sunny day and stay there for several minutes. Your body will obviously feel hot and may even start to sweat. What does this experience tell you about the weather?
The weather is all around us, all the time. It is an important part of our lives and one that we cannot control. Instead the weather often controls how and where we live, what we do, what we wear and what we eat.
The scientific study of weather is called meteorology and a person who studies weather is called meteorologist.
Importance of Weather
Describe the importance of weather
Weather is an important part of the natural environment. It directly or indirectly affects many of our activities. The following are some of the reasons why weather is important to mankind and the surrounding environment:
- Weather is one of the fundamental processes that shape the Earth. The process of weathering breaks down the rocks and soils into smaller fragments and then into their constituent substances. In this way, weather plays a major role in erosion of the surface soil, hence shaping the earth.
- The weather of any given region is important because it has a considerable impact on the water, sunlight and temperature of an ecosystem. Variation in long-term weather patterns and tendencies can result in certain regions getting more or less water or sunlight than other areas. These factors play an important role by influencing the type of plants and animals that can survive in the area.
- Certain weather patterns can also cause dangerous storms and natural disasters. We tend to be acutely aware of the weather when we are faced with exceptional or dangerous phenomena that could endanger our property, safety or even lives. Such phenomena are, for example, strong winds, hail, heavy rainfall, sleet, ice and frost.
- Studying weather characteristics of a given place over along period of time (usually 30 to 40 years) enables the climatic conditions of that place to be established. Therefore, weather can be used as a basis for determining the climate of a given place.
- The knowledge of weather (and hence climate) enables people to carry out their economic activities depending on the weather and climatic conditions of their localities. For example, people living in cold areas which receive high rainfall can engage in dairy farming and the growing crops such as tea, coffee, banana, etc.
The Relationship between Weather and Human Occupations
Show the relationship between weather and humans occupations
There is a direct relationship between the weather condition and nature of human activity. Due to the fact that deserts experience very hot weather, it will be surprising to see tea or banana tree growing there. This way we can see a clear connection between the two. E.g, during rainfall, construction companies experience lows in business and meanwhile floods hinder transport on rivers
Weather
Geography Form 1
Elements of Weather
Name elements of weather
Weather elements refer to a combination of natural phenomena that make up the weather. There are several elements that make the weather and climate of a place. The weather elements are temperature, pressure, precipitation, wind, humidity, clouds and sunshine.
The study of these elements can provide the basis for forecasting weather and defining the climate. Now, let us study each element in more details:
Temperature
The temperature is how hot or cold the atmosphere is, usually measured by a thermometer and expressed in degrees on a Centigrade or Fahrenheit scale. There are several types of thermometers. The maximum thermometer shows the highest temperature reached during a given period, for example a day; while the minimum thermometer shows the lowest temperature recorded (the figure below shows maximum and minimum thermometers).

Maximum and minimum thermometers
The maximum thermometer is made of glass and contains mercury in the bulb. The minimum thermometer is also made of glass but contains alcohol instead of mercury. The thermometer is marked in degrees of Centigrade or Fahrenheit. When the temperature rises, the mercury expands and extends along a glass tube. Changes in temperature are shown by the length of mercury. For example, if the lowest temperature reads 12.5°C and the maximum temperature reads 24.0 °C, then the changes in temperature is calculated as 24.0 – 12.5 = 11.5°C.
The Six’s thermometer can also be used for measuring maximum and minimum temperature. The thermometer consists of a U-shaped glass tube. The metal index nearest to the bulb indicates the minimum temperature and the other metal index records the maximum temperature.
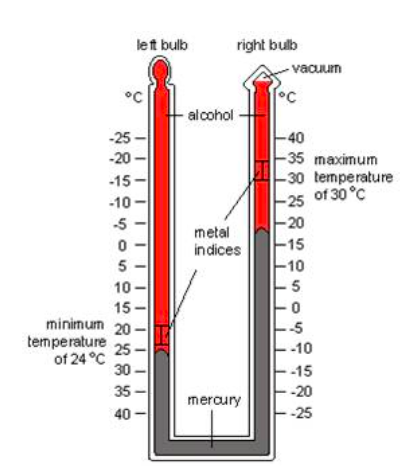
Six’s Thermometer. Can you read the max temperature and min temperature?
Temperature is a very important factor in determining weather. It influences or controls other elements of weather, such as precipitation, humidity, clouds and sunshine. The factors affecting (modifying) temperature include latitude, altitude, distance to the ocean and/or sea, orientation of mountain ranges toward prevailing winds (aspect) and ocean currents.
Reading and recording temperature
The maximum and minimum temperatures which are recorded for the day are used to calculate:
- daily range of temperature, which is the difference between the maximum and minimum temperatures; and
- the daily mean temperature, which is the average of maximum and minimum temperatures.
(Maximum + Minimum)/2 = Daily mean temperature
The monthly range of temperature is the difference between the highest daily mean temperature and the lowest daily mean temperature. To get the lowest mean temperature for a particular month, add up the mean daily temperatures and divide by the number of days in that month. For example, the mean monthly temperature for January is given by:
(M1 +M2 +M3 + ...... Mn)/31 where M1, M2, M3…….Mn are the mean daily temperatures for days 1, 2, 3……n; and 31 is the number of days in January. The same formula can be applied to obtain the maximum daily mean temperature for a particular month.
The annual range of temperature in a particular year is the difference between the highest mean monthly temperature and the lowest mean monthly temperature.
When reading and recording of data is done over a period of time, the obtained data can be shown on maps. These maps are called temperature maps. When comparing the temperature in different parts of the world, it is usual to make use of temperature maps. Different places with the same temperature conditions can be joined on the map by lines called isotherms.
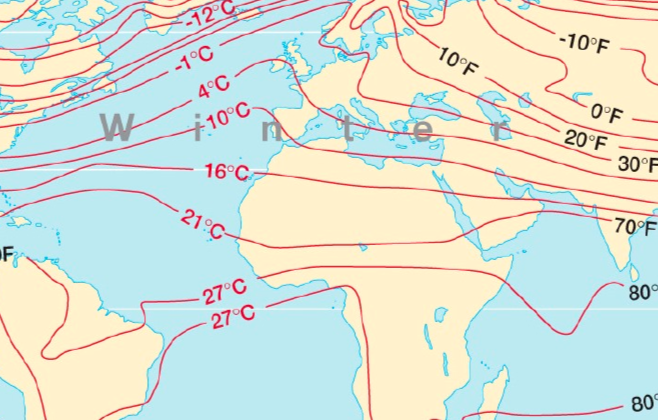
Isotherms
Relationship between temperature and altitude
Temperature decreases at the rate of 0.6°C for every 100 metres increase in altitude. Therefore, temperatures in highland areas are lower than temperatures in lowlands.
Apart from isotherms, another way of presenting the temperature data is using a graph. In this case, temperature figures are plotted on the graph and points are joined by a smooth line.
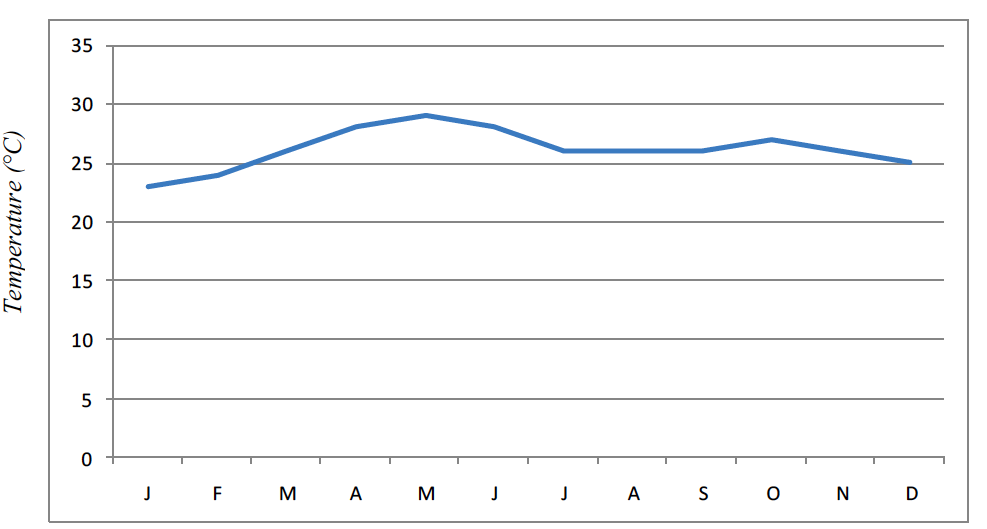
Average monthly temperature for Station X
Precipitation
This refers to the deposition of moisture on the earth’s surface from the atmosphere. This moisture includes rain, snow, ice, hail, mist and sleet.
Demonstrating the formation of rain
Boil some water in a pot. Just as the water starts boiling, hold a container filled with cold water over the pot. As the steam comes in contact with the container, it condenses to form droplets which will then fall down. This explains how rain is formed.
The sun’s heat causes water to evaporate from the surface of the oceans, lakes, rivers other water bodies, and land. This vapour rises into the atmosphere where it condenses to form clouds. Because the air is cooler at higher altitudes, the vapour is cooled to form small droplets that join together to form larger drops which are then too heavy to remain in the air, so they fall as rain. The diagram below shows the water cycle, also called the hydrologic cycle.
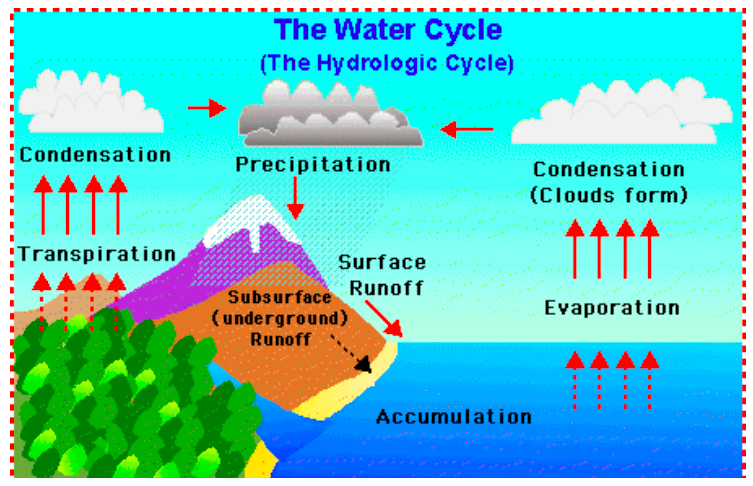
The hydrologic cycle
Types of rain
There are three types of rain as explained below:
Convection rain
This is a rain formed through the rising of the moist air currents, which condenses at higher altitudes to form clouds that result to rainfall.
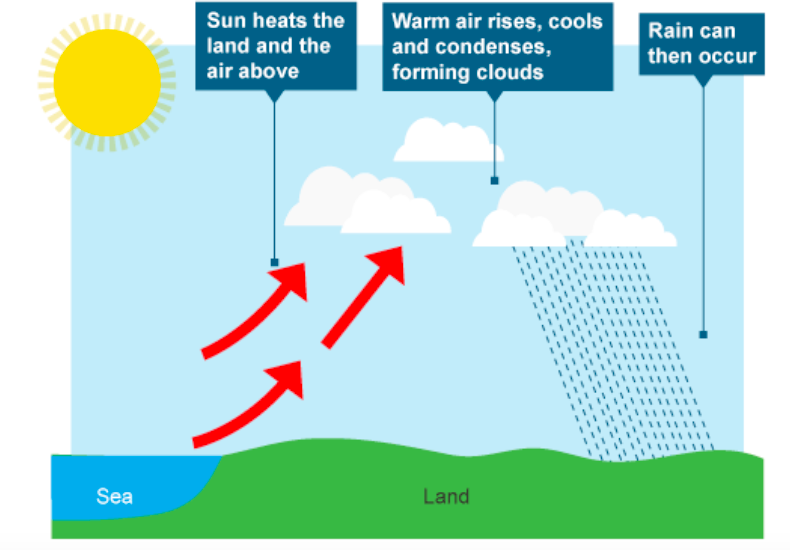
Convection rain
Orographic rain or relief rain
Sometimes moist winds are forced by a high mountain to rise and the moisture in it condenses to form rain. Rain formed in this way is called orographic rain. The side of the mountain facing away from the direction of wind gets little or no rain. This phenomenon is called the rain shadow effect.
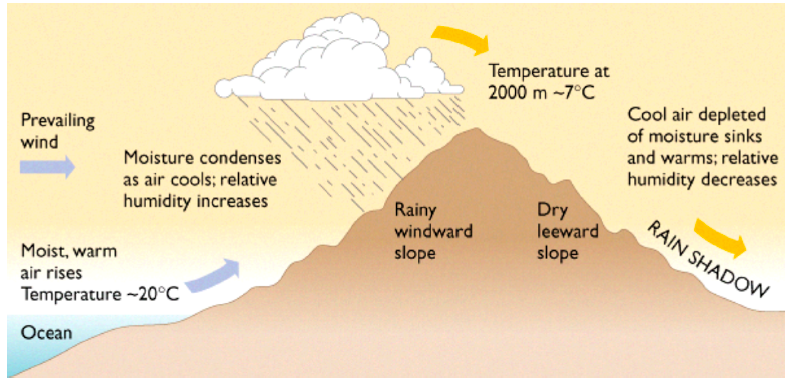
Orographic rain
An example of the rain shadow effect in Tanzania is found on the western side of Mount Kilimanjaro. Winds blow from the Indian Ocean in the east and are forced by this Convection rain mountain to rise up and drop moisture on the eastern and south western slopes. When these winds blow over to the western side of the mountain, they are already relatively dry. As a result, they bring very little rain to the Masai steppe. Other examples are the Rocky Mountains which affect the rain-bearing winds from the Pacific; and the Andes in Chile which affect the rain bearing winds from the Pacific on the Patagonia plateau.
Cyclonic rain
Cyclonic rain occurs when large masses of air with different characteristics of temperature and moisture meet. As the warmer and moist air is forced up over the cooler and dry air, it expands, cools and water vapour condenses to form clouds and rain.
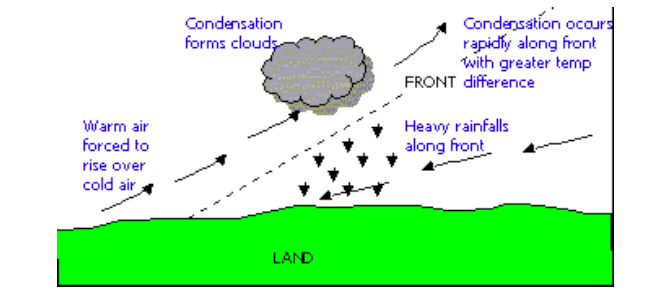
Cyclonic rain
On the other hand, tropical cyclones are formed over oceans in the tropics between latitude 8°N and 8°S. They usually bring very heavy rainfall and are associated with thunderstorms and very fast moving winds which often cause destructions along coastal settlements. In the Caribbean and USA, tropical cyclones are called hurricanes. In Africa they are known as cyclones, while in China and Japan they are called typhoons but in North Australia they are known as Willy–Willies.
Rainfall is measured by an instrument called rain gauge. Normally, the reading is done once every 24 hours. If need be, comments on the nature, time and duration of rainfall should be added to the record.
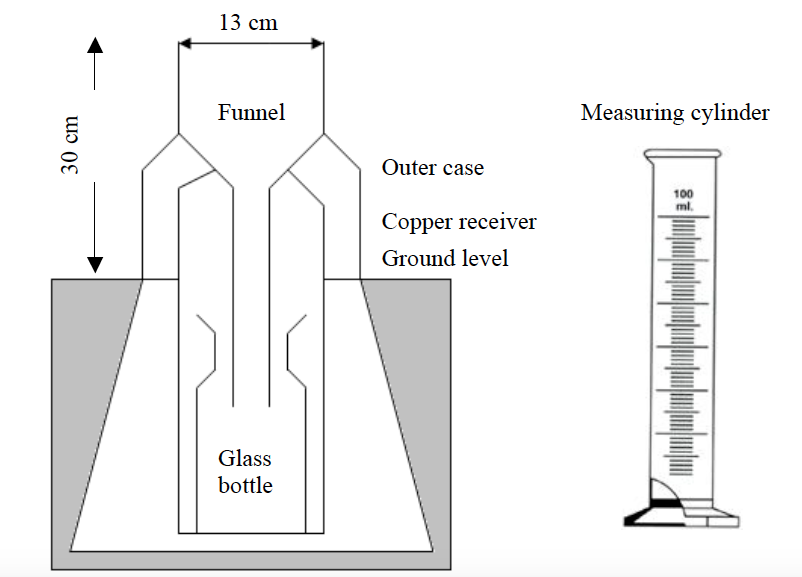
THE RAIN GAUGE
Rainfall figures entered in the record book for the month or several months can be represented in the form of graphs known as histograms (see the histogram below). Mean monthly rainfall records are usually obtained by adding up rainfall of a particular month (say January) for a number of years (say 30 years) and dividing this by the same number of years.
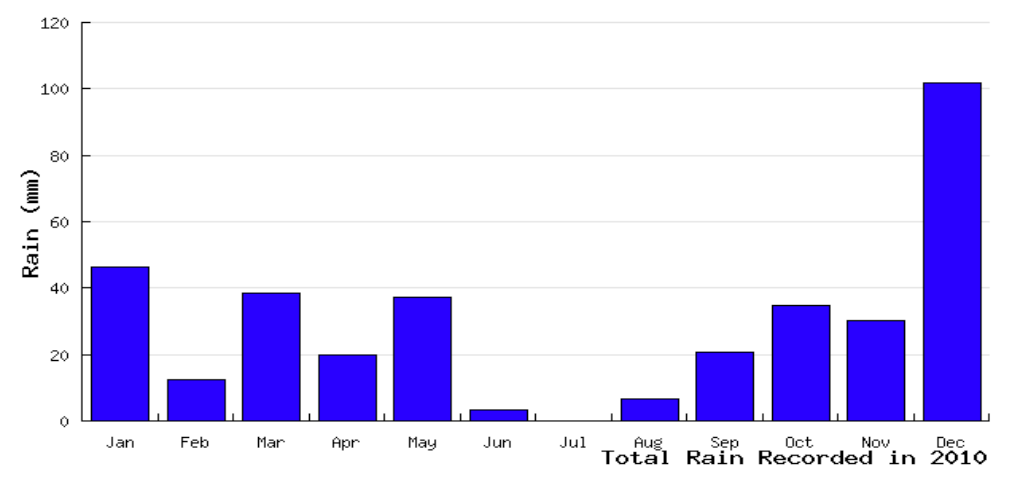
Total annual rainfall recorded at Weather Station X
Another way of presenting rainfall figures is by drawing lines on a map to link all places that receive the same amount of rainfall. These lines are called isohyets. They are usually drawn at uniform intervals.
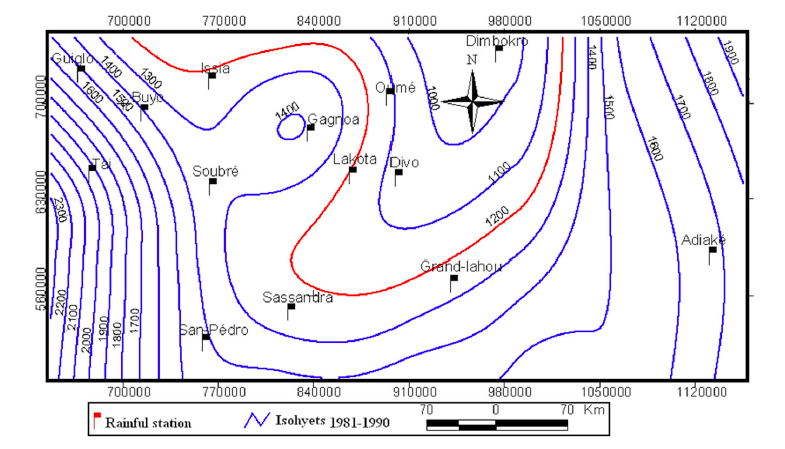
Isohyets
Importance of precipitation
Precipitation, especially rainfall, plays an important role in weathering of rocks. It dissolves the chemicals in rocks, thus helping to peel them apart. This action is called weathering. The weathered rocks in turn form the soil. Weathering is particularly influenced by temperature and rainfall.
Some sports such as skiing, skating, etc take place on frozen snow. Therefore, snow as a form of precipitation, acts as a playground on which numerous games and sports can take place.
Rain provides us with the water we need for various uses such as irrigation, drinking, washing, cleaning, etc. When it rains, water collects into streams and rivers from where it is collected, purified and supplied to homes for various purposes. Rain can be harvested directly as it falls from the sky. It is then stored in tanks for later use. Rain water is natural, pure and can be used without any further purification.
Rain is an important component of the water cycle and is responsible for depositing most of the fresh water on the earth. It provides suitable conditions for many types of ecosystems, as well as water for hydropower plants.
Humidity
Humidity is the state of the atmosphere in relation to the amount of water vapour it contains. Humidity indicates the degree of dampness of the air, and is one of the main influences on weather. It is expressed in either absolute or relative terms. Absolute humidity is the actual amount of water vapour present in a certain volume of air at a given temperature, expressed in grams per cubic metre. Relative humidity is the amount of water vapour present in a mass of air, expressed as a percentage of the total amount of water vapour that would be present when that air is saturated at that temperature. Air is saturated when the atmosphere cannot hold any more water vapour. This condition depends on the temperature and pressure of the air.
Humidity is measured by an instrument called hygrometer, which consists of wet and dry bulb thermometers. The wet bulb thermometer is kept moist (wet) by wrapping it in a muslin bag which is dipped in a container of distilled water. When the air is not saturated, water evaporates from the muslin and this cools the wet bulb causing mercury to contract. The dry bulb is not affected in the same way. So the two thermometers show different readings. But when the air is saturated the two thermometers show the same readings. Therefore, when there is a big difference in readings between the two thermometers, humidity is low and when there is a small difference, humidity is high.
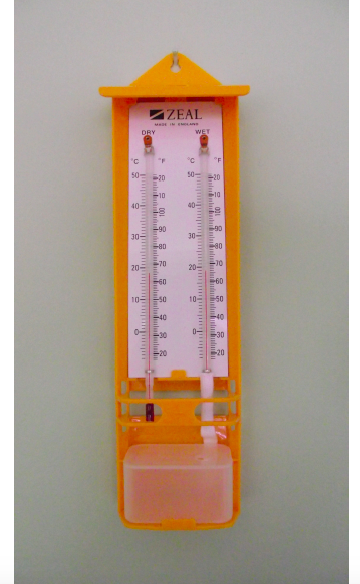
A hygrometer
The hygrometer consists of dry (left) and wet (right) bulb thermometers. Can you notice a muslin bag dipped in a container of water?
Absolute humidity is calculated after finding the dew point. Dew point is the critical temperature at which air becomes saturated with water vapour. Further condensation causes the formation of tiny drops of water called dew.
Atmospheric pressure
The air around us has weight. Atmospheric pressure (or air pressure) is the weight of the air resting on the earth’s surface. It is the weight exerted by air on the earth’s surface.
The force with which air presses down on a unit area is called atmospheric pressure. But this pressure is exerted equally in all directions. Atmospheric pressure can be demonstrated by the following experiment:
Take a glass full of water, cover the top of the glass with a piece of thin paper, and then hold the glass upside down. The water in the glass will not spill out because pressure of the air is pressing the paper so that it does not fall out.
Atmospheric pressure is measured by an instrument called a barometer. There are two types of barometers, mercury barometer, and aneroid barometer. Mercury barometer measures pressure in millimetres, usually expressed symbolically as mmHg, read as millimetres of mercury. The pressure at sea level is 76 mmHg. This is called standard pressure.
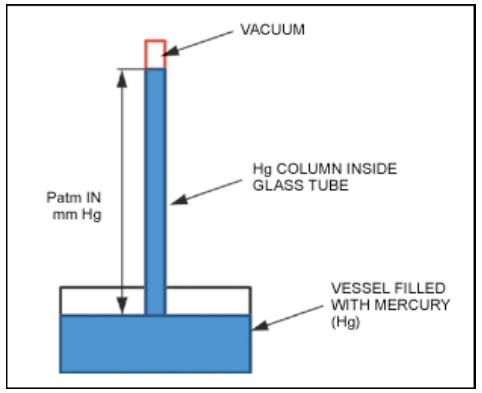
Simple mercury barometer
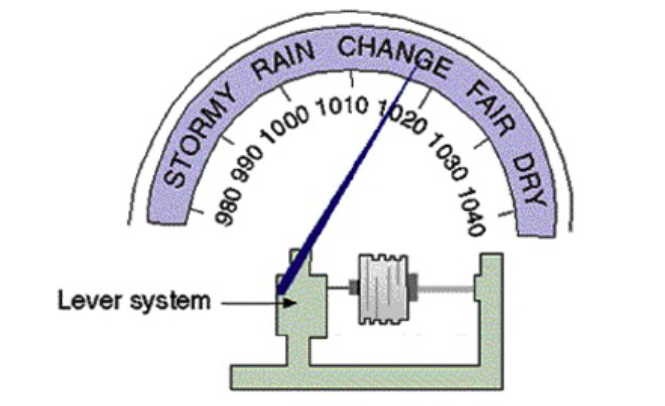
Aneroid barometer
Pressure is expressed in millimetres with reference to the height of mercury column. When using an aneroid barometer we express pressure in millibars of force per unit area. In physics, a unit of force known as a “dynes” per square centimetres is called a “bar” and is now the standard unit of pressure measurement. A bar is then divided into one thousand units called millibars. At sea level, pressure is normally 760 mmHg or 1.034 kilograms of force per square centimetre. This is equivalent to 1015.9 millibars or approximately one bar.
The diagram below shows the height of mercury column at high and low pressures. When the atmospheric pressure is high, mercury level is pushed up the glass tube. At low pressures, mercury column drops down.
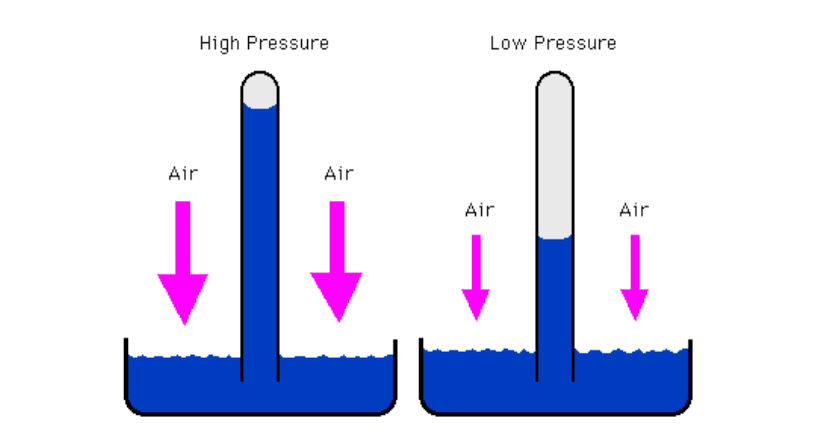
Pressure is shown on a weather map, usually called synoptic map. Lines drawn on a weather map joining places with the same pressure are called isobars.
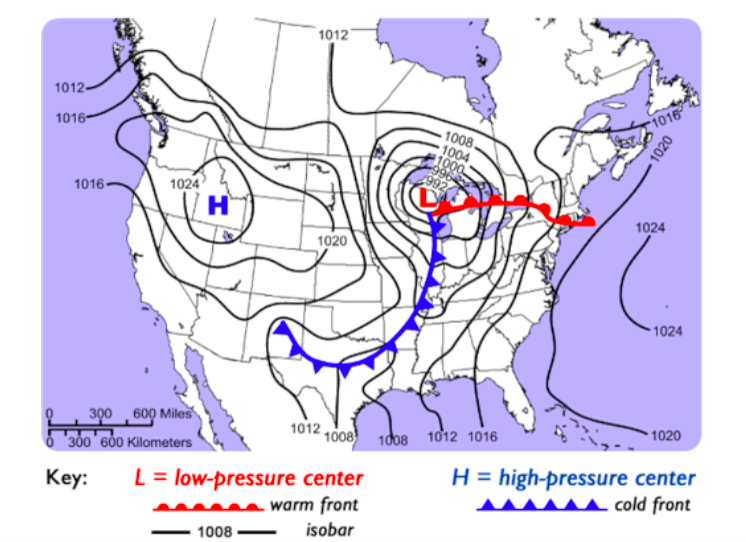
Isobars
The pressure is greatest at sea level where the whole thickness of the atmosphere exerts its weight. But pressure decreases at the rate of 10 millibars for every 100 metres increase in height. This is because the thickness of the atmosphere decreases, thus it exerts less pressure.
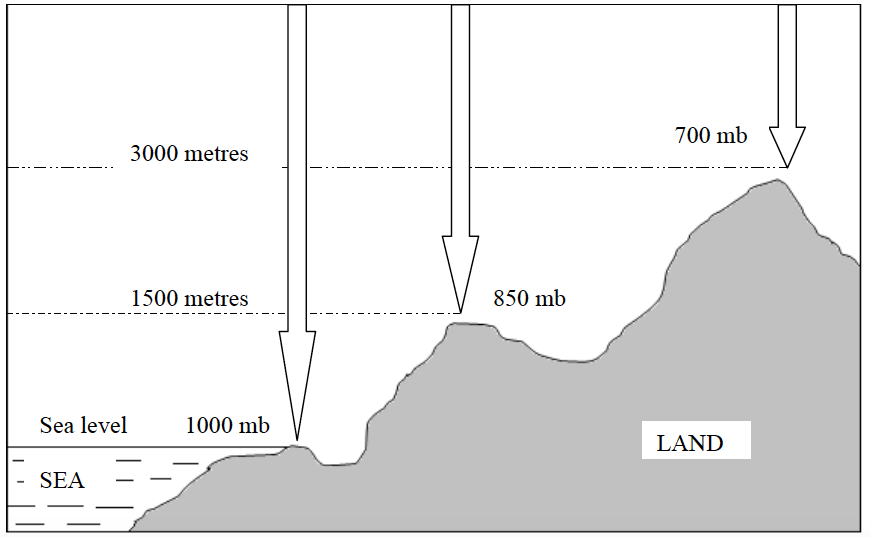
Relationship between pressure and altitude
Winds
Wind is the movement f air masses especially on the earth’s surface. Heated air expands, becomes less dense and rises up. Cooled air contracts, becomes denser and sinks down. When air sinks, its pressure increases because it is compressed, but when air rises, its pressure decreases because its molecules are spread over a large area. Areas from where heated air is rising are called areas of low pressure, while areas in which cool air is sinking are called areas of high pressure.
Usually, there is a movement of air from high pressure to low pressure areas, which is caused by differences in heating of air over different parts of the earth’s surface. The air that moves from a region of high pressure to that of low pressure is called wind. Wind is air in motion, from high pressure areas to low pressure areas.
During the day the land is usually warmer than the sea, and the air pressure on the land is lower than that over the sea. Therefore, air blows from sea to land. This kind of air movement (wind) is known as sea breeze. But during the night the land is cooler than the sea and there is low pressure on the sea. Therefore, winds blow from the land to the sea. This air movement is called land breeze.
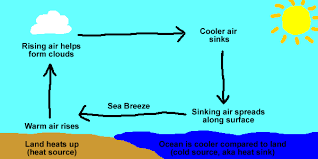
Sea breeze (day)
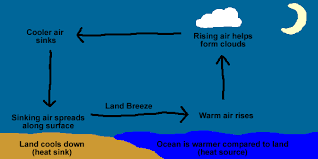
land breeze (night)
On the Earth’s surface, the regions of the north and south poles are very cold and have high pressure while the belt along the equator is very hot and has low pressure. This makes air move from the poles towards the equator. In the equatorial belt, rising air is replaced by air moving in from the north and south of the equator. We should then expect two belts of wind blowing towards the equator. But this is not exactly so because the earth rotates from west to east, and according to Ferrel’s law air or water moving freely in any direction over the Earth’s surface is turned (deflected) to the right of its course in the northern hemisphere and to the left in the southern hemisphere. Therefore, any winds blowing from the north towards the equator in the northern hemisphere will blow from the north east and not from the north, and any winds blowing from the south towards the equator in the southern hemisphere will blow from the south east and not from due south.
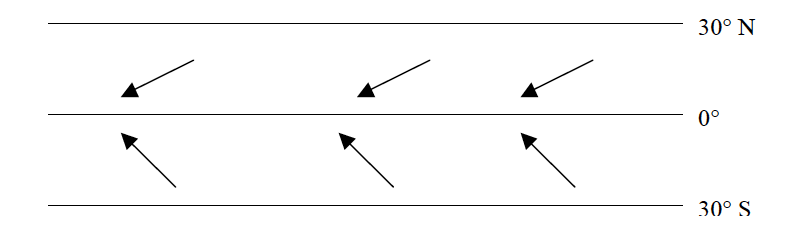
Winds blowing from NE and SE
In the equatorial belt of low pressure, between 5°N and 5°S latitudes, intense solar heating causes the moist air to rise in great convection columns. This belt is called the doldrums or low pressure belt. The rising air spreads out and moves towards the poles. In so doing, it cools and thus contracts, and develops high pressure. This occurs around 30°N and 30°S. Thus, the air sinks and builds up high pressure at these latitudes. These latitudes are called horse latitudes or subtropical high pressure cells.
In latitudes 30°N and 30°S some of the high pressure air moves over the surface towards the equator as the north east and south east trade winds. Some moves over the surface towards the poles as westerlies.
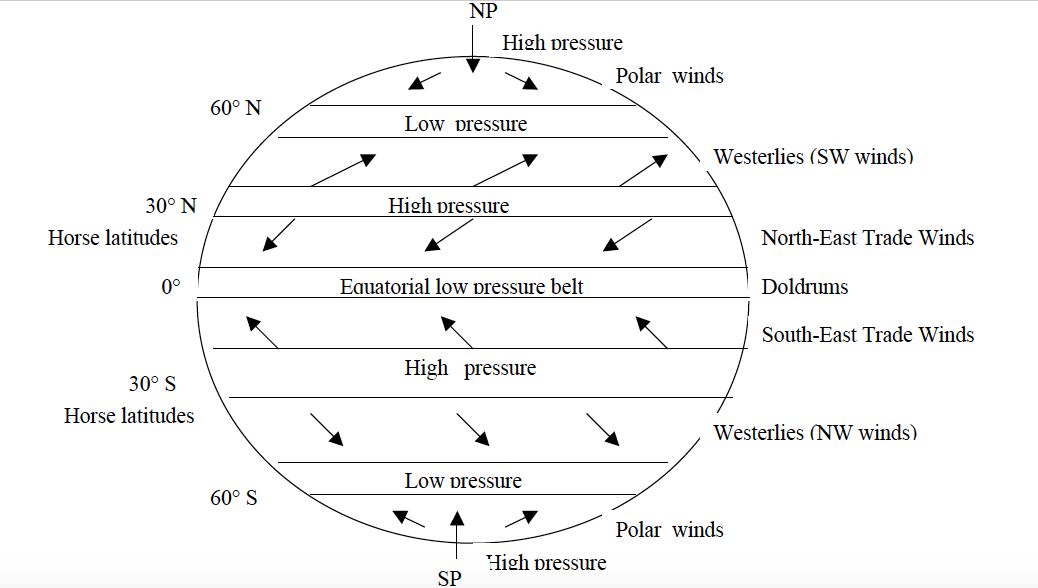
Wind belts of the world
In each hemisphere, there are three wind systems which operate between the indicated latitudes:
- The Polar wind system (between the North Pole and 60°N; and between the South Pole and 60°S).
- The tropical wind system (between 30°N and 60°N; and 30°S and 60°S).
- The equatorial wind system (between 30°N and 30°S).
Occasionally in the westerly wind system, depressions and anticyclones develop. A depression is an area of low pressure in which winds blow inwards in a circular motion. This motion is anti-clockwise in the northern hemisphere and clockwise in the southern hemisphere. A depression develops when cold heavy air comes in contact with warm most air. Depressions are usually associated with cyclonic rains. Anti-cyclones are areas of high pressure in which winds blow in a clockwise, circular motion in the northern hemisphere. They are associated with cool fine weather with no rain and they normally follow a depression.
Wind direction is measured by a wind vane or wind sock.
The wind vane consists of a freely rotating arm, fitted over a central rod. The arrow of the wind vane always points in the direction from which the wind blows, and the wind is named after this direction. Four arms marking the direction of the cardinal points are fixed to the stationary central rod.
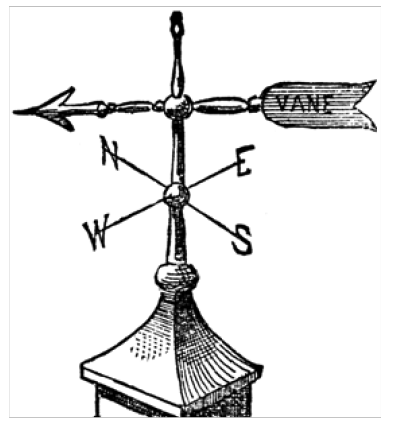
A wind vane
Wind sock consists of a sock-like sheet of cloth fitted to top of a tall wooden or metal bar, just like the flag is fitted to the flag post. The tail of the sock points away from the direction of wind, and the direction of wind is named after the head of the sock.
Wind socks are mainly used to show wind directions at airports and airstrips in order to direct pilots when landing or taking off.
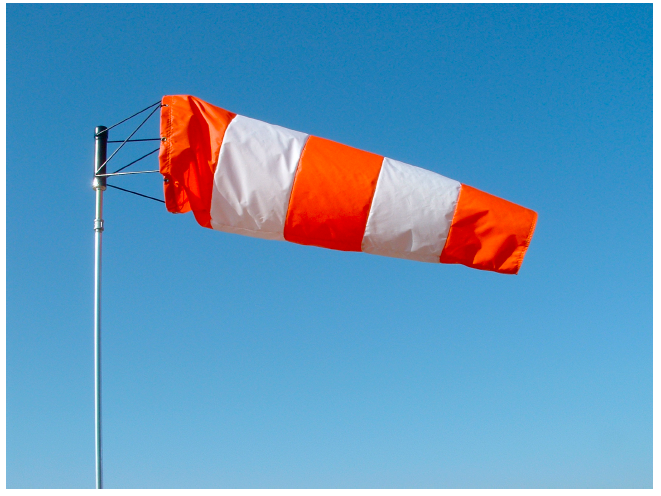
Wind sock
Wind speed is measured by an instrument called an anemometer. This instrument consists of three or four horizontal arms pivoted on a vertical shaft. Metal caps are fixed to the end of the arms so that when there is a wind the arms rotate. This movement operates a meter which records the speed of wind in kilometres per hour.
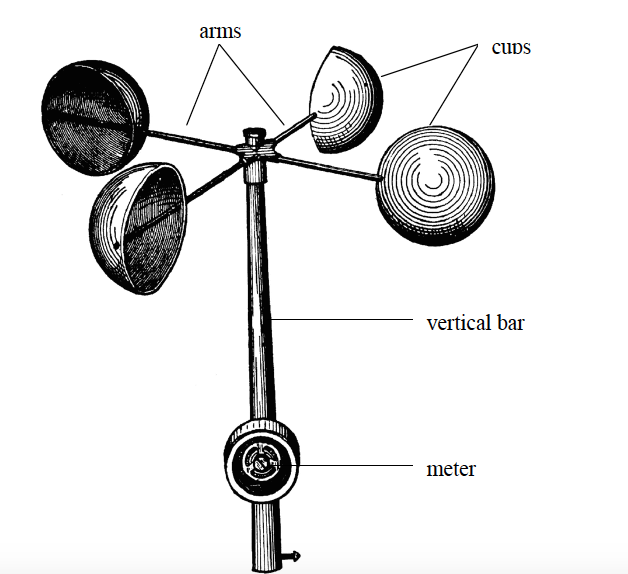
Anemometer
Cloud cover
Cloud cover (also known as cloudiness, cloudage or cloud amount) refers to the fraction of the sky obscured by clouds when observed from a particular location. The cloud cover is observed by using eyes. There is no special instrument for recording the cloudiness. Okta is the usual unit of measurement of the cloud cover. One okta represents approximately 1/8 of the sky with cloud cover. If approximately 3 segments out of 8 are covered in clouds, then the cloud cover is written as 3/8 cloud cover. These are 3 oktas. 8/8 means the cloud is completely covered by clouds. The figures below represents the symbols used to represent cloud cover in oktas.
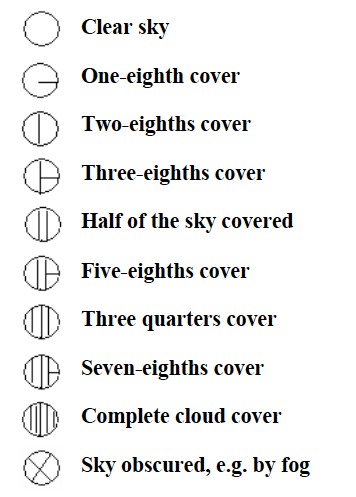
Symbols used to show cloud cover
Simple observation can be made such as:
- Clear - no cloud cover.
- Partly cloudy - less than half cloud cover.
- Mainly cloudy - more than half cloud cover but with some breaks in the cloud.
- Overcast - complete cloud cover.
Sunshine
The amount of sunshine we have depends on latitude and how much cloud there is in the sky. In some of the world's deserts the number of sunshine hours is very high, more than 3,600 hours each year. In the Eastern Sahara desert, the sun is covered by clouds for less than 100 hours a year.
Hours of sunshine are usually recorded on a simple machine called a parheliometer also known as a Campbell-Stokes recorder.
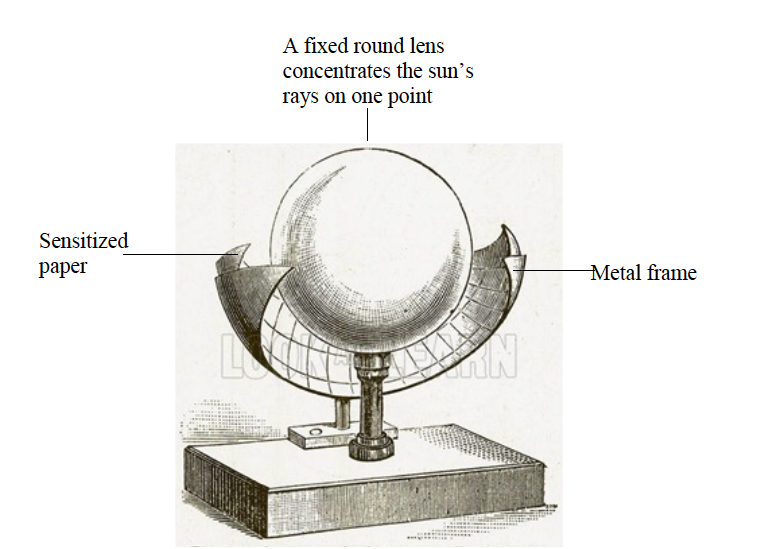
Campbell’s Sunshine Recorder
It works by using a glass ball to focus the sunlight and rays onto a strip of card. As the sun moves round during the day, the card is scorched, creating a record of how many sunshine hours there were.
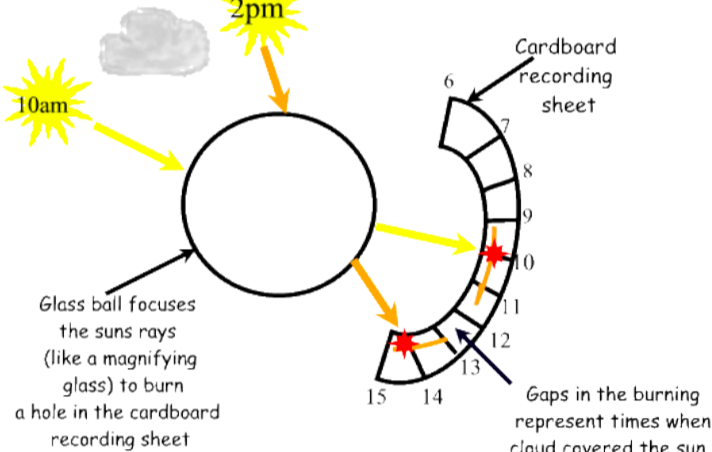
Importance of sunshine
The energy from the sun can be trapped, harnessed and put into various uses including cooking, heating, lighting and operating machines. It also affects the amount of heat received on the earth. When the sun shines for many hours, the temperature of the earth rises and when there is no sunshine the temperature drops down.
The sun’s energy is used by green plants to make their own food through the process of photosynthesis. Solar energy is also used to dry crops, clothes, etc. Our skins are also capable of converting the solar energy into vitamin D.
Evaporimeter
An evaporimeter is an instrument used to measure the speed and amount of evaporation of water from the surface of the earth. There are two types of evaporimeters:
Tank evaporimeter—measures evaporation from an open and free water surface. The tank is filled with water to a known level and then exposed in an open area which is free from obstructions where water is left to evaporate. The water level is measured using a micrometer screw gauge. Any reduction in the level of water is because of evaporation.
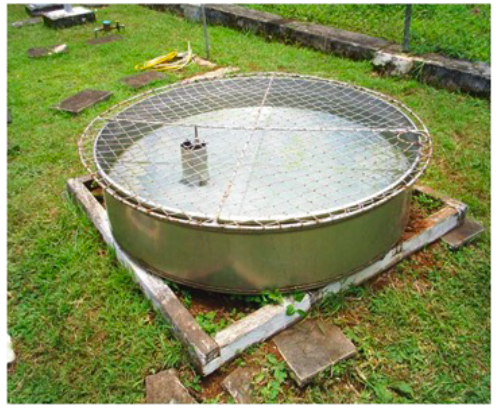
Tank evaporimeter
Piche evaporimeter—measures evaporation from a continuously wet and porous surface.
Importance of Elements of Weather
Explain the importance of each element
Importance of temperature
- Temperature is an important factor in rain formation. Temperature causes the evaporation of water vapour from water bodies, land and plants. The resulting water vapour then condenses to make clouds that form rain.
- Temperature is the main factor in the creation of wind. When the sun heats the earth’s surface unevenly, the resulting changes in temperature create changes in pressure and density. The ultimate result of these changes is the movement of air from a region of high pressure (cold area) to an area of low pressure (heated area). This movement of air is called wind.
- Plant growth and development is also highly influenced by temperature. It affects transpiration, seed germination and the rate of photosynthesis in different ways.
- Temperature controls planting dates and the growth of plants as well as insect pests and crop diseases. As an integral part of weather, temperature also determines the type of precipitation that might occur if you are in a location that is experiencing near freezing.
Weather
Geography Form 1
Meaning of Weather Station
Define weather station
A weather station is a facility, either on land or sea, with instruments and equipment for measuring atmospheric conditions to provide information for weather forecasts and to study the weather and climate. The measurements taken include temperature, barometric pressure, humidity, wind speed, wind direction, and precipitation amounts.
Wind measurements are taken with as few as other obstructions as possible, while temperature and humidity measurements are kept free from direct solar radiation, or insolation. Manual observations are taken at least once daily, while automated measurements are taken at least once an hour. Weather conditions out at sea are taken by ships and buoys, which measure slightly different meteorological quantities such as sea surface temperature, wave height, and wave period.
Weather station data can be used to gauge current weather conditions and to predict the future weather forecast, like temperature high/lows, cloud cover and probability of precipitation. Weather stations are used by meteorologists, weather buffs, gardeners, farmers, outdoor enthusiasts, students, pilots and anyone who enjoys weather data or relies on the weather to make decisions.
How to Establish Elements of Weather
Explain how to establish elements of weather
Selecting an appropriate site for the weather station is critical for obtaining accurate meteorological data. Typically, the site should represent the general area of interest, and be away from obstructions such as buildings and trees.
When establishing a weather station the following guidelines must be considered:
- The station should be located on an open space with free circulation of air.
- There should be a wide view of the surrounding landscape and the sky.
- The site should be free from obstructions by trees, buildings, mountains, etc. The station should not be under the shadows of objects. The open areas should be covered by short grass, or where grass does not grow, the natural earth. Avoid large industrial heat sources, rooftops, steep slopes, sheltered hollows, high vegetation, shaded areas, swamps, areas where snow drifts occur or low places holding stagnant water after rains.
- The ground should be plain or gently sloping at a gradient not more than 5°.
- The station should be fenced to keep off intruders, trespassers and passers-by and should always be locked. Only authorized people should have access into the station.
- The geographical location of the station should be established by placing a compass in the station. This will help in determining the direction of wind shown by a wind sock /vane put in the station.
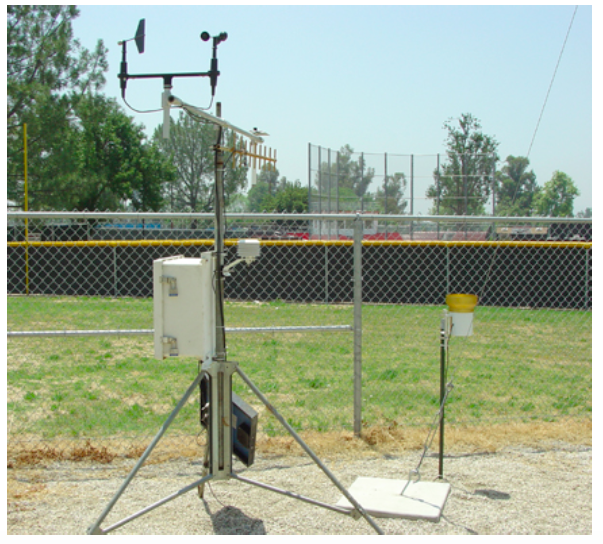
A weather station
Characteristics of a Stevenson Screen
Describe characteristics of a Stevenson screen
A Stevenson screen or instrument shelter is an enclosure intended to shield meteorological instruments against precipitation and direct heat radiation from outside sources, while still allowing air to circulate freely around them. It forms part of a standard weather station.
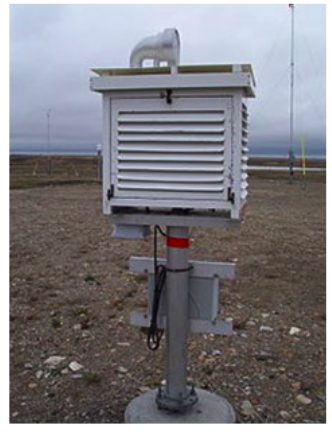
Exterior of a Stevenson screen
Characteristics and Functions of Instruments Used to Measure the Elements of Weather
Describe the characteristics and functions of instruments used to measure the elements of weather
The Stevenson screen holds instruments that may include thermometers (ordinary, maximum/minimum), a hygrometer, a psychrometer, a dew cell, a barometer and a thermograph. Its purpose is to provide a standardized environment in which to measure temperature, humidity, dew point and atmospheric pressure.
The traditional Stevenson Screen is a box shape, constructed of wood, in a doublelouvered design. However, it is possible to construct a screen using other materials and shapes, such as a pyramid. The World Meteorological Organization (WMO) agreed standard for the height of the Stevenson Screen is between 1.25 m and 2 m above the ground.

Interior of a Stevenson screen
The siting of the screen is very important to avoid data degradation by the effects of ground cover, buildings and trees. It is recommended that the screen be placed at least twice the distance of the height of the object, e.g., 20 m from any tree that is 10 m high. In the northern hemisphere, the door of the screen should always face north so as to prevent direct sunlight on the thermometers. In polar regions, with twenty-four hour sunlight, the observer must take care to shield the thermometers from the sun and at the same time avoiding a rise in temperature being caused by the observer's body heat.
The general purposes of the Stevenson Screen are:
- to ensure the safety of the delicate instruments kept in it which could easily be damaged if kept in the open air;
- to ensure accurate measurements of the meteorological data; and
- to protect instruments against precipitation and direct sunlight and heat, while still allowing air to circulate freely around them.
Measuring Elements of Weather
Measure and record elements of weather
Activity 1
Measure and record elements of weather
The Meaning of Weather Forecasting and How it is Done
Describe the meaning of weather forecasting and how it is done
Weather forecasting is the application of science and technology to predict the state of the atmosphere for a given location.
Weather forecasting methods
The nature of modern weather forecasting is not only highly complex but also highly quantitative. There are several different methods that can be used to create a forecast. The method a forecaster chooses depends upon the experience of the forecaster, the amount of information available to the forecaster, and the level of difficulty that the forecast situation presents. The various methods used in forecasting the weather are as follows:
Numerical method
More recently it has been realized that other methods can more accurately predict the future weather than was possible in the past. The numerical method involves a lot of mathematics. This method is based on the fact that gases of the atmosphere follow a number of physical principles. If the current conditions of the atmosphere are known, these physical laws may be used to forecast the future weather.
Numerical weather forecasting is made possible by making observations of the atmosphere by means of radiosonde stations all over the world. A radiosonde is a small weather station coupled with a radio transmitter. The radiosonde is attached to a helium or hydrogen-filled balloon, generally called a weather balloon, and the balloon lifts the radiosonde to altitudes exceeding 30 km. During the radiosonde’s ascent, it transmits data on temperature, pressure, and humidity to a sea-, air-, or land-based receiving station. Often, the position of the radiosonde is tracked through GPS, radar, or other means, to provide data on the strength and direction of winds aloft. Thus the radiosonde flight produces a vertical profile of weather parameters in the area above which it was launched.
At precisely the same time each day (0000 and 2400 UTC), weather personnel across the planet release radiosondes to the sky. The data obtained are processed, correlated with data from other radiosondes, and used to create an instantaneous picture of weather conditions throughout the world. The data are used not only to understand current weather patterns but also as inputs for longer-range computer-based forecasting models.
A radiosonde
Satellites
Radiosonde data are supplemented by means of radiometric observations from satellites which also provide data on humidity and cloud cover. For viewing large weather systems on a worldwide scale, weather satellites are invaluable. Satellites show cloud formations, large weather events such as hurricanes, and other global weather systems. With satellites, forecasters can see weather across the whole globe: the oceans, continents, and poles. Recent satellite data is very detailed, even to the point of showing states and counties.
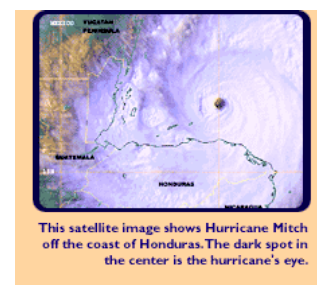
Persistence method
This is the simplest way of producing a forecast. This method assumes that the conditions at the time of the forecast will not change. For example, if it is sunny and 30°C today, the persistence method predicts that it will be sunny and 30°C tomorrow. If ten millimetres of rain fell today, the persistence method would predict ten millimetres of rain for tomorrow.
Trends method
This method involves determining the speed and direction of movement for fronts, high and low pressure centres and areas of clouds and precipitation. Using this information, the forecaster can predict where he or she expects those features to be at some future time. For example, if a storm system is 100 kilometres west of your location and moving to the east at 20 kilometres per day, using the trends method you would predict it to arrive in your area in 5 days.
Climatology method
The Climatology Method is another simple way of producing a forecast. This method involves averaging weather statistics accumulated over many years to make the forecast. For example, if you were using the climatology method to predict the weather for Dar es Salaam on July 4th, you would go through all the weather data that has been recorded for every July 4th and take an average. If you were making a forecast for temperature and precipitation, then you would use this recorded weather data to compute the averages for temperature and precipitation.
If these averages were 33°C with 0.18 inches of rain, then the weather forecast for Dar es Salaam on July 4th, using the climatology method, would call for a high temperature of 33°C with 0.18 inches of rain. The climatology method only works well when the weather pattern is similar to that expected for the chosen time of year. If the pattern is quite unusual for the given time of year, the climatology method will often fail.
Importance of weather forecasting
Weather forecasters alert farmers of the prospects of and amount of rainfall that is expected in a particular area. This enables them to decide what kind of crops to grow. If the forecast indicates little rainfall, then the farmers are advised to grow crops that resist drought or those that take a short time to mature. It, therefore, enables farmers to plan their farming activities well and in advance.
Weather forecasts and warnings are the most important services provided by the meteorological profession. Weather warnings are also important because they are used to save lives and protect property. The forecast saves lives and prevents the destruction of properties. For example, forecasters often warn people about the coming of extreme weather events such as tsunamis, earthquakes, floods, hurricanes or strong winds so that they can vacate their residence to save lives and property. This also enables people to get prepared to face the aftermath of these extreme weather events. In severe weather situations, short-term forecasts and warnings can help save lives and protect property.
Natural disasters such as hurricanes and tornadoes result from certain weather pattern combinations and can injure or kill thousands of people depending on their scope. These disasters often do lasting damage to cities and ecosystems as well. Because of this, being able to predict and understand weather patterns is a very useful skill when preparing for disaster.
Forecast based on temperature and precipitation is very important to agriculture and therefore to traders purchasing, transporting and selling agricultural produce.
Sailing and air travel are also highly controlled by the weather. We often hear of cancellation of air and sea travels due to harsh weather conditions. Accurate weather forecast therefore enables the marine and air transport personnel to schedule their travels in advance.
On everyday basis, people use weather forecast to determine what clothing to wear on a given day. Since outdoor activities are severely curtailed by heavy rain, snow and wind, forecast can be used to plan activities around these events and prepare to survive them.
Weather forecasting in Tanzania
In Tanzania, weather forecast is conducted by Tanzania Meteorological Agency (TMA). This is a government body responsible for weather forecasting and dissemination of forecasting information to the general public. The agency forecasts weather on daily basis and alerts the public about the prospects, intensity and the expected consequences likely to be caused by weather phenomena such as rainfall, storm, sea waves, atmospheric pressure. Information about the forecast is used by the government to protect life and property. It is also used by individuals to plan a wide deal of their daily activities.
The Concept of Climate
Define the concept of climate
Climate is the average weather conditions of an area observed and recorded over a long period of time (about 30 years).
The scientific study of climate is called climatology and a person who studies climate is called climatologist.
Climate
Geography Form 1
The Difference between Weather and Climate
Differentiate between weather and climate
There are marked differences between weather and climate. The table below summarizes these differences.
| Weather | Climate | |
| Describes the atmospheric conditions at a specific place and time. | Describes the average atmospheric conditions of a place over a specific period of time. | |
| Weather is defined as the day to day state of the atmosphere, and it is short-term (minutes to weeks) variation. | Climate is defined as statistical weather information that describes the variation of weather at a given place for a specified time interval. | |
| Weather conditions are measured over a short period e.g. a few hours or days. | Climate conditions are measured over many years, e.g., 30 years. | |
| Determined by real time measurements of atmospheric pressure, wind speed and direction, humidity, precipitation, cloud cover, and other variables. | Determined by averaging weather data over periods of 30 years. | |
| Weather changes abruptly within a short period. | Climate changes slowly and gradually over many years. | |
| Weather varies from one place to another within a region. | Climate remains uniform over a large area. | |
| Most weather elements are measured by weather instruments. | Climatic elements are not measured but calculated from the recorded weather data. |
Factors influencing weather and climate
Usually, the elements of weather (which make up climate) vary from place to place. In the lesson on weather we learned about the elements of weather. Because climate is influenced by weather, the elements of weather are the same as the elements of climate. Therefore, the factors that cause variation in weather elements will likewise influence the climate. The factors influencing climate and weather are discussed below:
- Latitude:This factor influences temperature and rainfall. Areas around and close to the equator experience higher temperature and receive higher rainfall than those farther away. So the rainfall and temperature decreases as one moves away from the equator.The amount of heat received at any place on the earth’s surface depends on the angle at which the sun’s rays strike the surface of the earth and the duration of the sunshine. At the equator, the sun’s rays fall on the Earth’s surface at almost right angles throughout the year, but the angle at which the sun’s rays strike the Earth’s surface decreases as one moves towards the poles.Therefore, temperatures decrease with increase in latitude because the equator receives vertical rays of sunlight while the north and the south poles receive slanting rays. Because of this fact, the equator and places near the equator are hotter while places in or near the south and north poles are colder.
- Altitude:This influences temperature and atmospheric pressure of an area. Temperature decreases with increasing altitude at the rate of 0.6°C for every 10 metres rise in altitude. Therefore, low-altitude areas are warmer than high altitude areas. Atmospheric pressure decreases with increasing altitude. Pressure at sea level is higher than pressure at the summit of a high mountain.
- Ocean currents:The nature of the ocean current influences the temperature of the wind blowing over it and transfers this influence to the land adjacent to the ocean. This will either lead to reduction or increase in the temperature of the land depending on the type of the ocean current. The wind blowing over warm ocean currents will pick moisture from the ocean and often causes heavy rainfall over the land while the wind blowing over the cold ocean current brings little or no rainfall to the land.
- Distance from the sea:This influences temperature and rainfall. Places located near the sea experience high temperature and receive high rainfall than those located farther away. This is because of high rates of evaporation from the water surface, which eventually causes heavy rainfall along the coastal areas. For this reason, coastal regions often experience higher temperatures and rainfall than inland areas.
- Aspect:This term refers to the direction in which a slope faces. It influences temperature and rainfall. For example, the south facing slopes in the northern hemisphere are always warmer than the north-facing slopes. Also the windward side of the mountain receives heavier rainfall than the leeward side.
- Wind and air masses:Wind carries moisture with it as it flows. Warm wind blowing over a cold region warms the cold region over which it flows. However, if the wind is cold, it cools the region.Warm, moist wind blowing towards a cold, dry region may lead to formation of rainfall in the destination region. Cold, dry wing blowing over a dry region brings no rainfall and if the blowing is repeated over several years, it may cause aridity in that region.
- Alignment of the coastline:This refers to the arrangement of the region’s coastline in relation to the direction of the wind. If the winds blow across the coastline they cause rainfall. If they blow in parallel to the coastline, they cause drought.
- Intertropical Convergence Zone (ITCZ):This is a low-pressure area around the equator. The moist winds meet within this region. Places farther away from this zone experience only one rainy season while places close to the zone experience two seasons of heavy rainfall. This is because the winds converge around this region twice a year.
- Forests:Areas covered with forests normally receive high rainfall as compared to those with little or no vegetation. This is because of high rates of evaporation and transpiration, leading to high humidity. Therefore, these areas often, receive high amounts of rainfall and have a modified climate.
- Human activities:A range of human activities such as agriculture, mining, transportation, construction, etc affects the climate. For instance, clearing of the forests to get land for agriculture and settlement leads to the loss of biodiversity, making the land arid and unproductive
Climate
Geography Form 1
Relationship between Climate and Human Activities
Relate climate to human activities
Climate has many impacts to human activities. Various economic activities conducted by man in different parts of the world are governed by the type of climate experienced in a particular region. For example, people living in deserts and semi-arid regions do not practice much agriculture because their environment does not favour crop cultivation or animal husbandry. In these regions, however, a very limited agriculture and animals rearing is conducted. The animals kept include camels, goats, sheep, donkeys and other hardy animals. Only drought resistant crops such as dates are grown in deserts and arid areas.
In tropical and equatorial regions, a lot of agriculture is carried out. The inhabitants of these regions take part in cultivation of crops and keeping of animals. Crops grown include cocoa, banana, horticultural crops and grains. The animals kept in these climatic zones include cattle, pigs, donkeys, horses, poultry and other farmyard animals. Specific types of various economic activities carried out in each climatic region will be discussed in detail in the section below.
THE MAJOR WORLD CLIMATIC REGIONS
Different regions of the world experience different amount of temperature and rainfall. The differences in the amount of rainfall and temperature experienced in different regions of the world make them have different climatic characteristics. This gives rise to various climatic regions around the globe. Temperature and rainfall are the main elements that determine the type of climate. Both elements vary considerably from one region to another and form a basis for classifying climate. The five broad types of climate are hot, warm, cool, cold and arctic (very cold) climates. Each of these climates is further subdivided into different subtypes as it will be explained in detail below:
HOT CLIMATES
These are the type of climates found within the tropics, mainly between 23?° north and 23?° south of the equator. Hot climates include the following climate sub types:
- Equatorial climate
- Tropical continental climate
- Tropical monsoon climate
- Tropical marine climate
- Tropical desert climate
Equatorial climate
The region is found approximately between 0° and 5° north and south of the equator. It may extend up to 10° north or south of the equator in some regions. Examples of areas found within this region include the Amazon basin (South America), and the Congo basin, the southern Ivory Coast, south Ghana, western coastal Nigeria, and eastern coastal Malagasy Republic (all in Africa).
Climatic characteristics
- There are no marked seasons.
- High temperature throughout the year: - The annual temperature range is about 3°C. - The daily mean temperatures are about 26°C all the year round.
- The daily temperature range is rarely more than 8°C because of the thick cloud cover.
- Rainfall is heavy and is usually convection rain.
- Rainfalls usually occur in the afternoons and they are accompanied by lighting and thunder.
- Total annual rainfall is about 200 mm with two maxima (peaks).
- High humidity and intensive cloud cover throughout the year This climate can generally be described as hot and wet throughout the year, with a small annual temperature range.
Highlands located within the equatorial region have their temperatures modified by altitude. The temperature of some of these highland areas, e.g., the East African Highlands, is lowered to about 15°C. These regions are said to have a modified equatorial climate.
Variations on the basic type of climate occur in the highland regions of equatorial Africa. The climate of most of these regions has an equatorial rainfall pattern.
In areas such as the south-eastern Nigeria, Cameroon, the south-east Asian islands of Malaysia, Indonesia and the Philippines, the climate is equatorial monsoon because of the seasonal reversal of winds. This results in even heaver rainfall.
Human activities carried out in the equatorial climate region include shifting cultivation and plantation agriculture. Crops grown in this region include yams, cassava, maize, millet, sweet potatoes, sorghum, beans, water melons, bananas and groundnuts. Examples of areas where this type of farming is practiced include some parts of West Africa and Asia.
In plantation agriculture, crops such as cocoa, rubber and oil palms are grown on large scale farms. Most rubber plantations are found in Malaysia, Indonesia, Thailand and Srilanka. They are also found in Liberia. Cocoa plantations are found in Brazil and West Africa (Ghana, Nigeria and Ivory Coast). Oil palms are grown in Nigeria, Malaysia and Indonesia.
Rainforests are also common in equatorial regions. In Africa, the equatorial forests are found in the Democratic Republic of Congo (RDC), Gabon and some parts of West Africa.
Tropical continental climate
This climate is also known as Sudan type or Savannah climate. In the interior of the continents it is referred to as tropical continental climate.
Location: This climatic region occurs between 5oN and 15oN and 5oS and 15oS though it extends to 25o north or south of the equator. It is best developed in most parts of Africa, and some parts of South America, India and Australia.
Climatic characteristics
- Hot summers (32oC) and cooler winters (21oC).
- The annual temperature range is about 11oC.
- The highest temperatures occur just before the rainy season begins.
- Heavy rains, mainly convection, occur in the summer.
- Total annual rainfall is around 765mm, though this increases in the areas lying close to the equatorial climate region. Similarly, rainfall decreases towards the tropical deserts.
- Humidity is high during the hot, wet season.
This climate is characterized by tall grass and trees which are more numerous near the equatorial forest region. The savannah region is suitable for herbivores animals such as giraffes, elephants, buffaloes, rhino, zebras, antelopes, wildebeests and many other animals. There are also carnivorous animals such as lions, leopards, hyenas, etc. The region also supports a variety of species of birds, reptiles and insects.
People living in this region mainly engage in livestock keeping, cultivation and tourism. Also lumbering is practised. Many tourists come from foreign countries to view the wildlife that live in the vast grassland. Numerous national parks have been established in this region. In Tanzania, for example, there are established national parks such as Serengeti, Mikumi, Selous, Tarangire, Ruaha, Saadani, Ngorongoro, Katavi and Manyara.
The major crops grown in this region are maize, millet, groundnuts, beans, onions, cotton, tobacco, sugarcane, sisal, rice and coffee.
Tropical monsoon climate
The areas which mainly experience monsoon type of climate are South East Asia, Northern Australia, Southern China, and the Indian subcontinent. This type of climate is most marked in India.
Climatic characteristics
- Seasonal reversal of winds (monsoon winds); onshore during one season and offshore during another season.
- Onshore wind brings heavy rain to coastal regions while offshore winds bring little or no rain, except where they cross a wide stretch of the sea.
- Temperatures range from 32ºC in the hot season to about 25ºC in the cool season, giving an annual range of about 7ºC.
- Annual rainfall varies greatly, depending on relief and the angle at which onshore winds meet the highlands (aspect).
- There are three marked seasons: cool, dry season; hot, dry season; and hot, wet season.
This climate can generally be described as having a hot, wet season and cool, dry season. The main human activities carried out in areas experiencing this type of climate include rice growing and livestock husbandry. Apart from rice, the other crops grown are wheat, millet, maize, and sorghum.
Sugarcane, cotton and juice are important lowland crops grown in India, Pakistan and Bangladesh. The other crops grown are tea (Sri-lanka, Bangladesh and India) and rubber in Malaysia. Animals kept in this climatic region include pigs, cattle, buffalos, sheep, goats, and poultry.
Tropical marine climate
Regions with this type of climate are located on the east coasts of regions lying between 10oN and 25oN and 10oS and 25oS. These areas are under the influence of onshore trade winds. The main areas are the east coasts of Brail and Malagasy, the lowlands of central American and the west indies the coast of Queen land (Australia) and the southern Islands of the Philippines.
Climatic characteristics
- Temperature characteristics are similar to those of the equatorial climate.
- Hot season temperature is 29ºC and cooler season temperature is 21ºC. (c) Annual temperature range is about 8ºC.
- Total annual rainfall varies from 1000 mm to 200 mm depending on the location.
- Rainfall is both convection and topographic (brought by onshore trade winds).
- Maximum rainfall occurs in the hot season.
- High humidity throughout the year.
This climate can generally be described as hot and humid throughout the year. However, the climate is cooled by the onshore winds blowing almost everyday.
The main human activities carried out in this climatic region include crop cultivation, lumbering and animal rearing. The crops grown include sugarcane, rice, banana and wheat. The animals kept are such as cattle, pigs, sheep, goats and poultry.
Tropical desert climate
The tropical desert climate occurs on the western margins of landmasses between latitude 20o to 30o north and south of the equator. The climate is experienced in all the major tropical deserts of the world. The hot deserts occupy about one third of the earth’s surface. The principal tropical deserts occur on the continents as follows:
- Africa: Sahara, Kalahari and Namib Deserts.
- Asia: the desert of Jordan, Syria, Iran, Iraq, Saudi Arabia and Israel, and the desert of India.
- North America: Mohave, Colorado and Mexican Deserts.
- South America: Atacama Desert.
- Australia: Great Australian Desert
Climatic characteristics
- Very little total annual rainfall (less than 120 mm in any one year).
- Mean monthly temperatures range from 29ºC in the hot season to 10ºC in the cool season.
- In most deserts, daytime temperature can rise to as high as 47ºC or more.
- Night temperatures can fall to as low as 16ºC in summer and 5ºC in winter.
- Very high diurnal temperature range (due to very hot days and very old nights).
- The annual temperature range is large. It is about 16ºC.
- Humidity is always low and therefore evaporation is high.
Desert environments support very minimal human activities. Wherever water is available as in oases (singular oasis), and along rivers, agriculture is practised. The crops grown include date palms, cotton, rice, sugarcane, vines, millet, tomatoes, tobacco and fruits. Apart from the people who live permanently in oases, there are nomads who move from one place to another in search of pasture. They keep camels, donkeys, goats and sheep. The camel is an animal that has adapted to desert conditions. It can survive for many days without drinking water. It is mainly used for transport in the desert. Other desert people are good hunters and also collect food from the bushes.
The other activities that can be done by desert dwellers include weaving mats, making ropes, and trading.
WARM CLIMATES
Warm climates border the hot tropical deserts. They occur between 30o and 40o north and south of the equator.
There are four broad types of warm climates:
- Warm temperature western margin;
- Warm temperature continental;
- Warm temperature eastern margin; and
- Warm temperature desert.
Warm temperate western margin (Mediterranean type). This is also known as the Mediterranean climate
This type of climate occurs between 30oN and 45oN and 30oS and 40oS on the western sides of the continents. Places experiencing the Mediterranean climate are on the coastal lands around the Mediterranean Sea (the Maghreb, Spain, Italy, Greece, Egypt and Israel), the western sides of north and South America (central California and central Chile), South Australia (Perth and Adelaide) and South Africa (Cape Province).
General characteristics
- Temperatures range from 21ºC in the summer to 10ºC (or below) in the winter.
- Mean annual temperature is about 15ºC.
- Annual total rainfall varies from 500 to 900 mm.
- Hot, dry summers and cold, wet winters. This is because westerly winds blow off shore in the summer and on shore in the winter.
The Mediterranean climate can generally be described as having hot, dry summers and middy, rainy winters.The climate permits a wide range of crops to be grown, which include fruits and cereals. It is in this region that much of the world’s citrus fruits are grown. Citrus fruits include oranges, lemons, grapes and limes. Other fruits grown here are peaches, apricots, plums, cherries, olives, almonds and pears.
The cereals include maize, wheat, rice and barley. Agriculture has given rise to specialized industries such as wine-making, flour-milling, fruit canning and food processing industries.
Warm temperate continental (steppe type)
This type of climate is also known as warm temperate interior region.
Location: It occurs in the interior of the continents, between 20o and 35o north and south of the equator. The best examples of the areas having this climate are Murray-Darling lowlands of Australia; The high Veldt of South Africa; and the central Paraguay and central Argentina (both in South America); central lowlands of north America (Oklahoma and Texas and in northern Mexico); central European lowlands, and the plains of Manchuria.
Climatic characteristics
- Temperatures range from 26ºC in the summer to 10ºC in the winter.
- The annual rainfall varies from 380 to 700 mm, depending on the distance from the sea.
- Rainfall is convectional type and falls mainly in spring and early summer. The main economic activities carried out in this region are cattle rearing and crop growing. Tourism is also practised.
Warm temperate eastern margin (China type)
Location: It occurs in the eastern sides of the continents between latitudes 23o and 35o north and south of the equator. The countries having this type of climate are central China, south eastern USA, southern Brazil, eastern part of Argentina, South Africa, southern Brazil, eastern part of Argentina, South Africa, southern Japan, and south eastern Australia.
Climatic characteristics
- Temperatures are about 26oC in summer and 13oC in the winter.
- The total annual rainfall varies is about 1000 mm.
- The rain is convectional and torrential type and it mostly falls in the summer.
Temperatures and rainfall in this type of climate make it possible to grow crops and keep animals. Lumbering is also practised in the forested areas. The crops grown include rice, maize, cotton, sugarcane and tobacco. Animals are extensively kept in Argentina and Australia. The animals produce products such as meat, milk, butter and cheese for consumption and export.
Warm temperate desert
This type of climate is also called mid-latitude desert climate. The areas having this type of climate include Nevada and Utah states of North America and Pentagonia in South America. It is also found in regions that extend from Turkey, northern Iran, across the Caspian sea and Aral areas into former USSR. It is also experienced in the Gobi desert of Mongolia.
COOL CLIMATES
These climates are experienced in regions between 35o north and 60o south of the equator. They are characterized by definite seasonal variations in temperature. There are four types of cool climates:
- Cool temperate continental (British type);
- Cool temperate continental (Siberian type);
- Cool temperate eastern margin (Laurentian type); and
- Temperate desert.
Cool temperate western margin (British type)
It occurs on the western sides of the continents between 45o and 60o north and south of the equator. Areas with this type of climate include North West Europe, British Columbia in western Canada, Southern Chile, Tasmania, and the south Island of New Zealand.
Climatic characteristics
- Winter temperatures range between 2ºC and 7ºC, while summer temperatures range from 13ºC to 15ºC.
- The annual temperature range is between 8ºC and 11ºC.
- Rain falls throughout the year, with maxima in winter.
- The total annual rainfall is about 760 mm.
- The rain is both convectional and cyclonic in nature.
People living in this region engage in a myriad of economic activities which include agriculture, mining, lumbering, manufacturing and commerce. Agriculture is of extensive type and includes keeping of beef and dairy cattle and sheep and the growing of wheat, barley oats, vegetables and fruits. In British Columbia lumbering is an important economic activity. In Tasmania and New Zealand, sheep rearing for wool and mutton is an important activity. Fruit farming, especially apples, is practised throughout the region.
Cool temperate continental (Siberian type)
This type of climate is found extensively in the northern hemisphere. It occurs in the interiors of North America and Eurasia between 35º and 60ºN
Climatic characteristics
- Moderately warm summers (18º) and very cold winters (-19ºC).
- The annual temperature range is very high (37ºC).
- Most of the rain falls in the summer.
- The rain is convectional type and is often accompanied with thunder.
- The annual precipitation (rain plus snow) ranges from 400 to 500 mm.
The main human activities in this region include lumbering fishing, mining and some agriculture.
Cool temperate western margin (Laurentian type)
It occurs on the eastern sides of the continents between 35oN and 5oN, and south of 40oS. It is experienced mainly on the eastern sides of North America and Asia.
Climatic characteristics
- Winter temperatures range from -10ºC to 4ºC.
- Summer temperatures range from 12ºC to 24ºC.
- The annual temperature range is large and averages 24ºC.
- Precipitation (in the form of rain and snow) is distributed throughout the year.
- Annual precipitation varies between 700 and 1000 mm. (f) Rainfall is both convectional and cyclonic.
The main economic activities in this region are farming, mining, and manufacturing. The crops grown include wheat, maize, millet and soya beans. Sheep farming is important in Patagonia. Mining and manufacturing are practised where minerals are found.
Temperate desert
This climate occurs in the interiors of Eurasia and North America, and in Patagonia (South America).
Climatic characteristics
- Winters are very cold with temperatures often below -7ºC.
- Summer temperatures vary between 25ºC and 37ºC.
- Diurnal temperature range is about 35ºC while the annual temperature range is about 40ºC.
- Precipitation is very low, it averages about 250 mm.
- Most of the rain falls in late winter and early spring.
The human activities carried out in this region include mining, animal rearing and some agriculture. The animals reared are such as camels, donkeys, sheep and goats. The main crops grown in this region are date palms, oil palms, and millet. Agriculture is mostly practised in oases and along river valleys.
COLD CLIMATES
Cold climates are mainly experienced in regions between latitudes 60ºN and 68ºN
There are three types of cold climates:
- Cold temperate western margin;
- Cold temperate continental; and
- Cold temperate eastern margin.
Cold temperate western margin
This climate is confined to coastal areas of Scandinavia and Alaska.
Climatic characteristics
- Short, cold summers with temperatures of about 12ºC.
- Long winters with temperatures ranging from -2ºC to 4ºC.
- Annual rainfall is about 750 mm.
- Rain falls in most months except the winter when show falls.
The main economic activities practiced in this region include agriculture, mining and manufacturing. Dairy cattle farming is mainly practiced in the Scandnavian countries such as Norway Denmark and Sweden.
Cold temperate Continental
This climate occurs between 55oN and 68oN in the interior of America and Eurasia.
Climatic characteristics
- Cold and long winters with temperatures ranging between -34ºC and -45ºC.
- Warm and short summers with average temperatures up to 21ºC.
- Annual precipitation is very low, about 380 mm.
- Most of the rainfalls in summer, but in winter, precipitation is in the form of snow.
Cold temperate eastern margin
This climate occurs in the north east pacific of Russia.
Climatic characteristics
- Long, cold winters with an average temperature as low as -20ºC or below.
- Short, hot summers with an average temperature up to 21ºC or higher.
- Total annual rainfall varies between 500 and 1000 mm.
ARCTIC CLIMATES
These types of climates are experienced in regions beyond the Arctic Circle (661/2oN) and around Arctic Ocean. They are also known as polar deserts. The main features of these climates are low amounts of precipitation (rain), mild summers and very cold winters.
Arctic climates comprises of Tundra and Polar climates
Tundra climate
This region occurs in the northern coast of North America, southern coast Greenland and the Arctic coast of Europe and Asia.
Climatic characteristics
- Very long, cold winters with temperatures ranging between -29ºC and - 40ºC.
- Short, cool summers with temperatures of about 10ºC.
- Annual precipitation is 250 mm; some of it falls as snow in winter and as rain in summer.
Polar climate
It occurs in the interiors of Iceland, Greenland and Antarctica.
Climatic characteristics
- Temperatures are permanently below 0ºC.
- Precipitation is in the form of blizzards (now storms).
- The winters consist of continuous night, and summers of continuous day.
Because temperatures are very low, most these regions are uninhabited and hence limited human activities take place here. The natural occupations are hunting, fishing and herding of reindeer.
Mountain climate
This type of climate occurs in the main mountain areas of the world. The areas that experience such climates include the East Africa Mountains, the Ethiopian highlands, the mountains and plateaus of central Asia, the Alps of Europe, the Andes of South America and the Rockes of North America.
Climatic characteristics
- Pressure and temperature generally decrease with increase in altitude.
- Precipitation increases with altitude.
- In areas around mountains within the tropic, temperatures may range from high at the foot of a mountain to very cold at the peak, e.g. Mount Kilimanjaro.
We have seen how particular climatic conditions influence human activities. Now, let us see how specific climatic conditions are suitable for given human activities.
Agriculture
Agriculture is strongly influenced by weather and climate. The nature of agriculture and farming practices in any particular location depends on the type of climate experienced in that location.
Crops thrive well in any area with a fertile soil and which receives sufficient rainfall as well as optimum temperature conditions. In such areas both commercial and subsistence crops may be grown.
The equatorial region receives high rainfall and experiences high temperature throughout the year. This climate is suitable for crops that can thrive well in moist and hot conditions. The crops that can be grown in this region include cocoa, banana, rubber, sugarcane and yams.
Livestock rearing can be practised in the tropics where rainfall permits the growth of pastures. This area also supports the cultivation of a variety of tropical crops such as fruits, tobacco, sugarcane, tea, maize, rice and a variety of horticultural and cereal crops
Cooler climates also support crops which grow better in climates like barley, wheat, oats, sugar beet, and fruits such as apples, peaches and apricots. These areas also support the rearing of dairy animals.
In semi desert and desert climates where very little rainfall is received, there are reduced agricultural activities. However, drought-resistant crops like millet, date palms, oil palms and sorghum can be grown. The keeping of hardy animals such as sheep, camels, donkeys and goats can be done.
Settlement
People like to establish settlements in areas with favourable climates and which support a variety of agricultural activities. Such areas are often well-populated. Very hot or extremely cold areas are usually sparsely populated because their climatic conditions are unfavourable for human settlement.
Forests thrive well in areas that receive ample rainfall and which have adequate temperatures. Dense forests of the world are concentrated in the equatorial and tropical climates which experience high rainfall and temperature throughout the year. The presence of forests in these regions stimulate lumbering and growth of other industries such as paper-making and carpentry.
Fishing
Most of the world’s fishing grounds are in cooler regions. The cooler water is thought to support the growth of water plants called plankton on which fish feed. Tropical areas are not suitable for fish as compared to regions with temperate climates.
Tourism
For tourism industry to flourish, the climate in the host countries must be favourable enough to attract the tourists to visit them. Tropical countries, like Tanzania, are often visited by tourists from cooler climates during winter in their home countries to enjoy the warmth of the tropical countries where they swim in warm waters and sunbath in tropical beaches.
Likewise, the tropical climate supports numerous wildlife which serve as tourist attractions. In Tanzania, for example, there are many national parks with thousands of wildlife species and beautiful sceneries. The animals found in the parks include elephants, buffaloes, zebras, lions, leopards, chimpanzees, monkeys and a variety of reptiles, amphibians, insects and plant species.
Industry
The establishment and growth of industries strongly correlate to the climatic conditions. Most industries are established in areas where raw materials are adequately available. For instance, milk, tea, tobacco, meat, fish and fruit processing industries are often located where raw materials are found. Likewise, lumbering industries are built close to forests.
Transport
Development of the transport systems in some climatic regions is very difficult. For example, the tropical and equatorial regions, which receive much rainfall throughout the year, have poorly developed roads. Routes passing through areas with clay soils become muddy and slippery when it rains. This makes it hard to travel on earthy and murram roads. Roads in desert regions may be blocked by sand blown onto them, making the roads impassable. In very cold regions, precipitation in the form of snow may cover roads, making them impassable during winter.
CLIMATE CHANGE
Climate change is a large-scale, long term shift in the planet’s climate (weather patterns and temperatures). The overall effect of climate change is termed as global warming.
Question Time 1
What is global warming?
Global warming refers to increase of the earth’s average surface temperature due to effects of the greenhouse gases. These gases trap heat that would otherwise escape from the earth. The greenhouse gases include water vapour (H2O), carbon dioxide (CO2), methane (CH4), dinitrogen oxide or nitrous oxide (N2O), ozone (O3) and chlorofluorocarbons (CFCs).
Since the early 20th century, the global air and sea surface temperature has increased by about 0.8°C, with about two-thirds of the increase occurring since 1980. Each of the last three decades has been successively warmer at the earth’s surface than preceding decades since 1850.
The recent rapid warming was caused by human activities which contribute to the production of greenhouse gases, such as carbon dioxide, that trap heat in the earth’s atmosphere. It is predicted that the continuation of these activities will result in 1.8–4°C average temperature increase over the next century.
Causes of global warming
Scientific understanding of the cause of global warming has been increasing. Global warming is mostly caused by increasing concentrations of greenhouse gases in the atmosphere. The following greenhouse gases are the main contributors to global warming. They are the main causes of global warming.
Carbon dioxide
Carbon dioxide is the main greenhouse gas. The gas contributes over 50% of the greenhouse effect. It is because of this reason that man is struggling to reduce carbon dioxide emissions. The following are some of the man-made sources of carbon dioxide in the atmosphere:
Deforestation: Green plants absorb carbon dioxide gas from the atmosphere and use it to manufacture their food through the process of photosynthesis. Cutting down trees means that a few trees are left to absorb carbon dioxide gas from the air. This has led to the increase in the amount of carbon dioxide in the atmosphere.
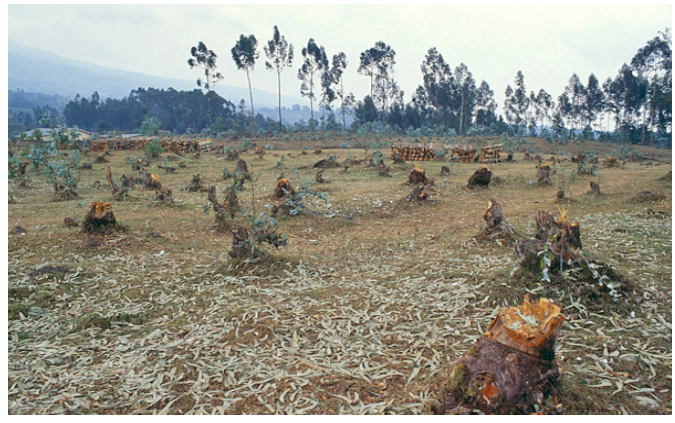
A deforested land
Combustion of fuel: Burning of fossil fuel such as wood, coal, petroleum and natural gas, releases carbon dioxide into the atmosphere. The gas is produced during combustion of these fuels in car engines, power stations, industries, etc.
Methane
The main source of methane is from agricultural activities. It is released from wetlands such as rice fields and from animals, particularly cud-chewing animals, like cattle. The emission of methane gas into the atmosphere, therefore, increases with increase in agricultural activities. Since 1960s the amount of methane in the air has increased by 1% per year, twice as fast as the build-up of carbon dioxide. Methane is also produced by the decomposition of waste materials by bacteria. It is the major component of natural gas. The gas is also produced during the mining of coal and oil (as natural gas) and when vegetation is burnt.
Nitrous oxide (dinitrogen oxide, N2O)
Dinitrogen oxide is produced from both man-made and natural processes. Human activities which produce dinitrogen oxide include combustion of fossil fuels in vehicles and power stations, use of nitrogenous fertilizers and burning of vegetation and animal waste. During combustion of fuel in automobile engines, the air gets so hot that nitrogen reacts with oxygen to form dinitrogen oxide.
The gas is also produced by digesting bacteria, and is part of the nitrogen cycle, one of the most important natural processes on earth.
Chlorofluorocarbons (CFCs)
The sources of CFCs in the atmosphere include refrigerators, air conditioners and aerosols. CFCs are extremely effective greenhouse gases. One CFC molecule is about 10,000 times more effective in trapping heat than a carbon dioxide molecule. Some of them are up to 14,000 times effective than carbon dioxide, the main greenhouse gas.
Effects of global warming
Global warming is expected to have far-reaching, long-lasting and, in many cases, devastating consequences for planet earth. The following are some effects of global warming:
Increase in average temperatures
One of the most immediate and obvious impacts of global warming is the increase in temperatures on the world. The average global temperature has increased by about 0.8°C over the past 100 years. Scientists predict that the earth’s average temperature will increase by between 1.4 and 5.8°C by the year 2100.
Increase in global temperature will affect both the land and the ocean environments. The average temperature of the oceans has increased significantly in the past few decades, causing negative effects on marine life.
When the ocean water gets warm, the algae in the ocean tends to produce toxic oxygen compounds called superoxides which are damaging for the corals. Global warming is threatening the coral reefs to a great extent, and the fact is that if coral reefs are wiped off the planet, it will affect one third of planet’s marine biodiversity, as well as other ecosystems related to the coral reefs directly or indirectly.
Extreme weather events
Extreme weather events include record-breaking high or low temperatures, floods or intense storms, droughts, heat waves, hurricanes and tornadoes, etc. These are effective measures of climate change and global warming.
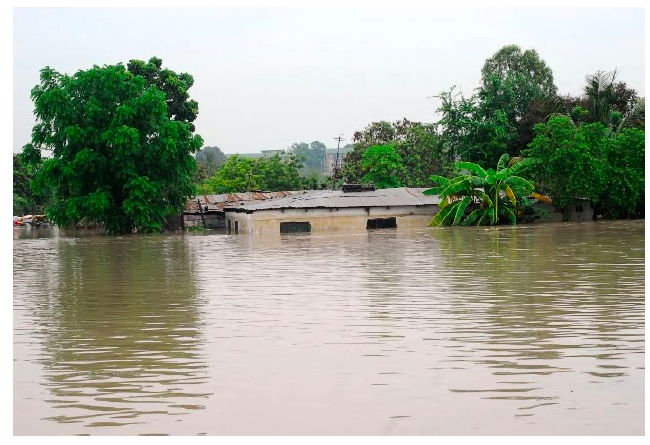
Floods
Scientists project that extreme weather events, such as heat waves, droughts, blizzards and rainstorms will continue to occur more often and with greater intensity due to global warming.
Other effects of extreme weather events include:
- higher or lower agricultural yields;
- melting of arctic ice and snowcaps. This causes landslides, flash floods and glacial lake overflow;
- extinction of some animal and plant species; and
- increase in the range of disease vectors, that is, organisms that cause diseases.
Change in world’s climate patterns
It is forecasted that global warming will cause climate patterns worldwide to experience significant changes. Climate change resulting from increasing temperatures will likely include changes in wind patterns, annual precipitation and seasonal temperature variations.
Climatic patterns in most parts of the world have already changed. Rains fall when least expected and at irregular intervals. This has greatly affected the timing of planting and harvesting activities. Sometimes the rains fall so heavily to cause floods, or too little leading to drought.
Most of the arable land that once used to be productive is slowly turning arid. With time, farmers will run short of the land for cultivation, a fact that will result in famine.
Because high levels of greenhouse gases in the atmosphere are likely to remain high for many years, these changes are expected to last for several decades or longer.
Rise in sea levels
Continued increase in the global temperature will cause the melting of ice caps in the poles and mountain glaciers. Melting polar ice and glaciers are expected to raise sea levels significantly. Global sea levels have risen about 8 inches since 1870 and the rate of increase is expected to accelerate in the coming years. If current trends continue, many coastal areas will eventually be flooded.
Scientists predict that by the year 2100 the sea level will raise by at least 25 m, leading to coastal flooding that will displace millions of people. Small islands in the Caribbean, South Pacific, Mediterranean and Indian Ocean will be totally covered by ocean waters.
Ocean acidification
As levels of atmospheric carbon dioxide increase, the oceans absorb some of it. This increases the acidity of seawater. Since the Industrial Revolution began in the early 1700s, the acidity of the oceans has increased about 25%.
Because acids dissolve calcium carbonate, seawater that is more acidic has a drastic effect on organisms with shells made of calcium carbonate, such as corals, mollusks, shellfish and plankton. The acid water is likely to dissolve the carbonaceous shells, thus endangering the lives of these sea creatures. Change in ocean acidity will also affect fish and other aquatic animals and plants.
If current ocean acidification trends continue, coral reefs are expected to become increasingly rare in areas where they are now common.
Effects on plants and animals
The effects of global warming on the earth's ecosystems are expected to be profound and widespread. Many species of plants and animals are already moving their range northward or to higher altitudes as a result of warming temperatures. Additionally, migratory birds and insects are now arriving in their summer feeding and nesting grounds several days or weeks earlier than they did in the 20th century.
Warmer temperatures will also expand the range of many disease-causing pathogens that were once confined to tropical and subtropical areas, killing off plant and animal species that formerly were protected from disease.
These and other impacts of global warming, if left unchecked, will likely contribute to the disappearance of up to one-half of the earth's plants and one-third of animals from their current range by 2050.
Effects on humans
As dramatic as the effects of climate change are expected to be on the natural world, the projected changes to human society may be even more devastating.
Agricultural systems will likely be affected badly. Though growing seasons in some areas will expand, the combined impacts of drought, severe weather, lack of snowmelt, greater number and diversity of pests, lower groundwater tables and a loss of arable land could cause severe crop failures and livestock shortages worldwide.
This loss of food security might, in turn, create havoc in international food markets and could spark famines, food riots, political instability and civil unrest worldwide.
The effect of global warming on human health is also expected to be serious. An increase in mosquito-borne diseases like malaria and dengue fever, as well as a rise in cases of chronic conditions like asthma, are already occurring, most likely as a direct result of global warming